
Take the mystery out of running your LNG plant
Many natural gas liquefaction plants with production capacities ranging from 0.5 MMtpy to 8 MMtpy use mixed refrigerants to cool and liquefy the feed. The mixed refrigerants used comprise a mixture of light hydrocarbon components and nitrogen for LNG subcooling. The composition of the refrigerant is optimized for each application to maximize performance.
When operating a mixed refrigerant loop, it is important that the vaporized refrigerant returning to the compressor is superheated to avoid liquid from accumulating in the bottom of the exchanger or the compressor suction drum or entering the compressor. It is also important for optimal performance that the vaporized refrigerant is not superheated too much. Too much superheating can increase pressure drop through the exchanger and result in inefficient use of the heat exchanger surface area due to large internal temperature differences.
Plant design heat and material balances serve as the basis for plant operations; however, LNG plants are often operated at conditions that are significantly different than the design. Changes in the mixed refrigerant’s composition, relative flow rates, LNG production, ambient temperature and refrigerant pressure can all result in too little or too much superheating of the vaporized refrigerant leaving the main exchanger. While process simulation software can be used by plant engineers to calculate the dewpoint temperature of the mixed refrigerant, this is of limited use to the plant operators at the control panel in maintaining an appropriate amount of mixed refrigerant superheat as they adjust the plant.
To address these challenges, the authors’ company has developed a simplified method of calculating mixed refrigerant superheat that can be programmed in the distributed control system (DCS) and made available to panel operators.
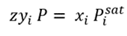
Calculation method. The method uses Raoult’s law, along with a slight modification to Dalton’s law, by introducing a fitted constant z to account for liquid and vapor non-ideality (Eq. 1):
 (1)
(1)
Where z is a single constant used for all compositions and pressures.
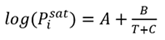
The saturation vapor pressure for each component is calculated using the Antoine equation (Eq. 2):
 (2)
(2)
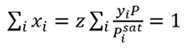
The dewpoint temperature of a mixture is when the vapor phase reaches the saturation point. At that point, the liquid phase composition must equal 1. This is shown by Eq. 3, which combines Eqs. 1 and 2, where yi is the mixture composition, and the requirement that the liquid phase mole fractions sum to 1.
 (3)
(3)
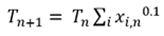
At the dewpoint temperature, Eq. 3 is correct. If the temperature used to compute Psat is too low or high, the sum of xi will not equal 1. The dewpoint temperature can be found using a damped successive substitution, with the temperature on iteration n+1 computed from the guessed temperature and xi values on iteration n (Eq. 4):
 (4)
(4)
For typical mixed refrigerant LNG liquefaction systems, the initial guess for the dewpoint (T1) can be assumed to be 10°C lower than the operating temperature.
FIG. 1 describes the convergence method. It is found that this method reliably converges within 6 or 7 iterations on temperature. TABLE 1 shows Antoine equation coefficients for typical refrigerant components from Hydrocarbon Processing.
FIG. 1. Mixed refrigerant superheat calculation method.
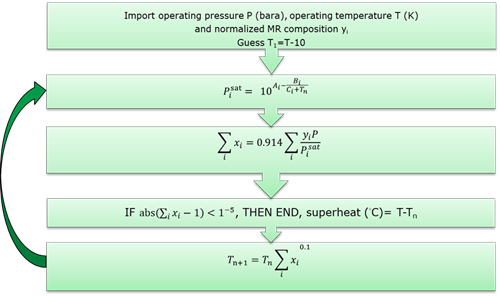
TABLE 1. Antoine’s equation coefficient for refrigerant components.1
|
|
Nitrogen |
Methane |
Ethane |
Propane |
Isobutane |
Butane |
Isopentane |
Ethylene |
|
A |
3.6194 |
3.7367 |
3.9276 |
3.9546 |
4.0354 |
3.9339 |
3.9581 |
3.6194 |
|
B |
255.678 |
389.982 |
656.403 |
813.201 |
946.35 |
935.86 |
1,040.73 |
255.678 |
|
C |
-6.6 |
-7.16 |
-17.16 |
-25.16 |
-26.47 |
-34.42 |
-37.705 |
-6.6 |
Accuracy of the method. To determine z, a Least Squares Data Fit was used. The authors’ company has evaluated this method of calculating dewpoint over a wide range of pressures and compositions that could be encountered while operating their proprietary technology liquefaction unit(s)a. The range of compositions is listed in TABLE 2, and the pressure varies from 2.5 bara–10.5 bara.
TABLE 2. Range of compositions for Least Squares Fit
|
Component |
Mole fraction |
|
|
Minimum |
Maximum |
|
|
Nitrogen |
0 |
0.15 |
|
Methane |
0.03 |
0.65 |
|
Ethane |
0.2 |
0.78 |
|
Propane |
0.03 |
0.35 |
|
Isobutane |
0.03 |
0.12 |
|
Butane |
0.03 |
0.12 |
|
Isopentane |
0.05 |
0.25 |
|
Ethylene |
0 |
0.65 |
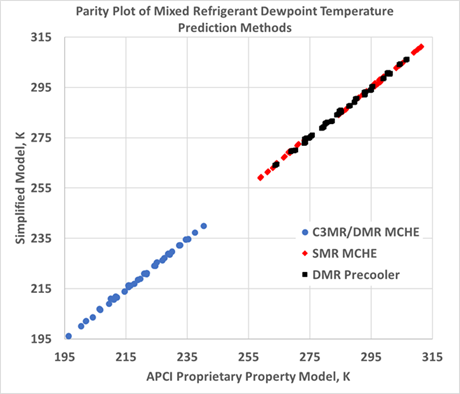
The data fit shows that using z=0.914 over the range of compositions and pressures, the average deviation from the authors’ company’s proprietary equation of state was 0.4°C, and the maximum deviation was less than 1.5°C. This is well within the accuracy needed for plant operations and control. FIG. 2 shows a parity plot comparing the dew point temperature predicted by this simplified method to the proprietary equation of state used by the authors’ company to design and rate LNG liquefaction units.
FIG. 2. Parity plot comparing the dew point temperature predicted by the simplified method to the proprietary equation of state used by the authors’ company to design and rate LNG liquefaction units.
Takeaway. This article provided a quick and accurate method that can be used within a DCS or other plant control software to compute the dewpoint of the mixed refrigerant leaving the main exchanger. Knowing this dewpoint allows the process to be optimized in real time. If desired, rather than using a tolerance test to stop the successive substitutions, as described in FIG. 1, simply repeating the substitution 6 to 8 times and stopping without checking will give sufficiently accurate results.
NOTE
a AP-C3MR, AP-DMR, AP-SMR or AP‑X liquefaction unit
LITERATURE CITED
1 Nevers, N., Physical and Chemical Equilibrium for Chemical Engineers, March 2012, John Wiley & Sons Inc., Hoboken, New Jersey, online: https://onlinelibrary.wiley.com/doi/pdf/10.1002/9781118135341.app1


Comments