
Identify anomalies among base prover volumes of bidirectional prover
It is important to accurately measure hydrocarbon commodities transferred through pipelines or marine terminals at the point where ownership of the commodity is transferred. To ensure accurate measurement, it is essential to quantify and adjust for the performance of flowmeters (e.g., turbine meters, ultrasonic meters, Coriolis meters) for the variations in the characteristics of fluid, operating process conditions, etc.
In the oil and gas industry, it is well-established to use a prover that provides a meter factor (MF) to facilitate defensible and traceable measurement. Bidirectional provers are one of the common types used in the industry. A typical bidirectional prover has a length of pipe through which a sphere travels, displacing liquid between two points known as a calibration section. The totalized flowmeter volume reading during the time required for the sphere to travel between the detecting points is compared with the known volume of the calibration section—also known as the base prover volume (BPV)—to provide accurate meter calibration data or establish a meter factor.
The accuracy of the meter factor, and therefore the measurement accuracy, by the flowmeter directly depends on the accuracy of the BPV. It is common industry practice to routinely recalibrate the prover to ensure measurement defensibility or calibrate and generate a revised prover base volume if one or more detectors are repaired or replaced.
Multiple prover volumes. The BPV is the established actual volume between the pair of detectors at standard or base condition. The actual volume between two detectors located on each side of the calibrated section is derived during the prover calibration process. A single pair of detector switches is required in a bidirectional prover to calculate the meter factor of the flowmeter. Often, a second pair of detectors is also provided to provide BPV redundancy. With multiple detectors (usually four), four different BPVs can be derived.
International standards provide a method and calculation procedure to derive the BPV between a pair of detectors.1–3 No industry practice is known to identify inconsistencies among multiple volumes derived using multiple detectors on the same prover (and mostly at the same time). Inconsistency among four BPVs implies that the value of at least one BPV is beyond estimated uncertainty (i.e., it has a larger-than-acceptable error).
The general objective of this article is to provide an analytical method to identify anomalies among these BPVs. The BPV could have been derived using a water draw or master meter method. The description of a commonly used water draw method is provided in the next section.
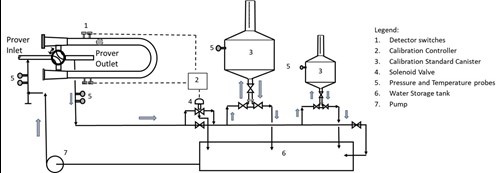
Water draw method of prover calibration. FIG. 1 illustrates the typical setup and components required for bidirectional prover water draw calibration.
 |
|
FIG. 1. Setup and components required for bidirectional prover water draw calibration. |
The water draw method is generally preferred, where feasible, to calibrate the prover and establish the BPV, as it provides the least uncertainty compared to other methods of calibration. Water draw is normally used during the initial calibration of the prover to ensure and establish the BPV footprint with the least uncertainty.
In the water draw method of prover calibration, the volume of water between two detectors is displaced and directly drawn into calibration standard measures. A calibration controller diverts displaced water to the reservoir when the sphere is not in the calibration section and in standard measures when the sphere is displacing water in the calibration section.
During calibration operation, when the sphere is outside the calibration section, the displaced water from the prover is directly returned to the water reservoir without filling standard measures. Due to the push of the water pumped from the reservoir, when the sphere approaches and activates the detector at one end of the prover, the calibration controller operates the solenoid valve to divert water to the standard measures. The bypass manual valve, located in parallel to the solenoid valve, can now be manually opened to achieve the desired calibration flowrate.
Once the sphere is about to reach a detector on the other end of the prover, the bypass manual valve is closed. As the sphere activates the detector switch, the water flow is now diverted directly to the reservoir. The water collected in the calibration measures represents the volume of water drawn from the calibration section of the prover at operating condition. This process is repeated in forward and reverse directions multiple times as guided by international standards and procedures. The repeatable prover volumes are delivered during multiple calibration passes calculated at base conditions and averaged to establish the BPV for that pair of detectors.
The water draw process is repeated four times to establish four independent BPVs for the prover with four detectors (two pairs of detectors).
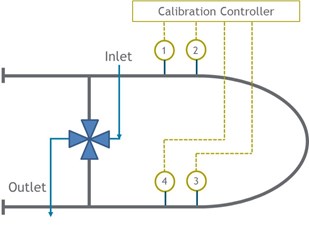
FIG. 2 illustrates a bidirectional sphere prover, which is normally constructed in a U shape. For easy understanding of the concept, the prover is illustrated in a straight line in other figures.
 |
|
FIG. 2. A bidirectional sphere prover. |
TABLE 1 illustrates the multiple BPVs that can be derived using four detectors on a typical prover and other associated parameters.
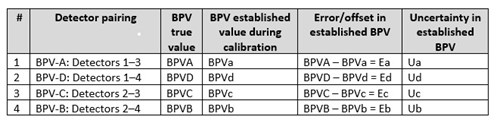 |
| TABLE 1. Multiple BPVs derived using four detectors on a typical prover |
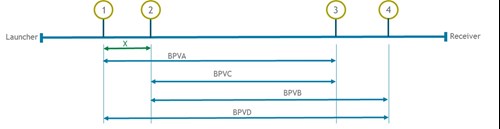
The prover volume between Detector 1 and Detector 2 is small and normally not calibrated nor established. For the purpose of the discussion in this article, the volume between these switches is depicted as X in FIG. 4 and Eqs.1 and 2. Similarly, the prover volume between Detector 3 and Detector 4 is small and normally not established.
 |
|
FIG. 4. True value of BPV. |
Measurement and uncertainty. Practically, it is impossible to derive the true value of the parameters, as all measurement processes present inherent uncertainties. Uncertainty is a parameter associated with the result of measurement that characterizes the dispersion of the values that could reasonably be attributed to the measurement. Uncertainty of a measured value is an interval around that value, such that any repetition of the measurement will produce a new result that lies within this interval. Uncertainty defines a statistical interval around the measured value within which true value is expected to lie.
FIG. 3. illustrates the typical values of BPVs that could be derived with four detector switches. The derived BPV will be smaller or larger than the true value. The true value of the BPV is expected to lie within uncertainty intervals of the established BPV, as shown by the interval in the red line for each BPV.
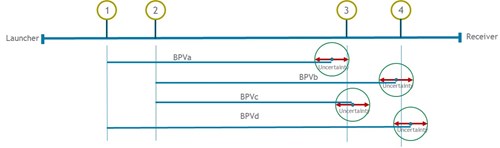 |
| FIG. 3. Acceptable value of established BPV. |
Potential inconsistencies. International standards and industry best practices provide guidelines and methodologies on calibrating provers and criterion to validate the established BPV. One well-established criteria is repeatability within intermediate prover volumes in forward, reverse and round-trip during prover calibration for each pair of detectors. Industry practices or standards do not provide guidelines on the verification of consistencies among these four BPVs. Considering the fact that detectors are common within multiple volumes, the methods described in subsequent sections will provide indications on inconsistencies.
Identifying inconsistencies. In FIG. 4, it can be stated that the value of X can be calculated by Eqs. 1 or 2:
|
| FIG. 4. True value of BPV. |
X = BPVA – BPVC (1)
X = BPVD – BPVB (2)
For the true value of BPVs (i.e., using BPVA, BPVB, BPVC and BPVD), the value of X obtained by Eqs. 1 or 2 will be the same (Eq. 3):
BPVA – BPVC = BPVD – BPVB
or, in other words:
BPVA + BPVB – BPVC – BPVD = 0 (3)
Practically, it is impossible to derive the true value of the BPV during calibration; as such, the established BPV would not satisfy Eq. 3 but would have the value of Etotal (Eq. 4):
BPVA + BPVB – BPVC – BPVD = Etotal (4)
Based on the relation of between the true value of the BPV and the established value of the BPV (as provided in TABLE 1), Eq. 4 can be rewritten as:
(BPVA + Ea) + (BPVB + Eb) – (BPVC + Ec) – (BPVD + Ed) = Etotal
BPVA + BPVB – BPVC – BPVD + Ea + Eb – Ec – Ed = Etotal
or, in other words (Eq. 5):
Ea + Eb – Ec – Ed = Etotal (5)
(as BPVA + BPVB – BPVC – BPVD = 0 per Eq. 3).
As the true values of the BPVs are not known, Ea, Eb, Ec and Ed could assume a “+” or “–“ sign. The maximum value of Etotal will happen when errors in BPVA and BPVB are of the opposite sign as the errors in BPVC and BPVD.
Per the characteristics of the term uncertainty, the maximum error in each of the established BPVs should be less than the estimated uncertainty in the established BPVs. So, the equation can be written as (Eq. 6):
Ua + Ub + Uc + Ud = Utotal ≥ Etotal (6)
When errors in the established BPVs are within the estimated uncertainty, Etotal ≤ Utotal will hold true. In other words, it can be stated that if Utotal is less than the totals of errors (i.e, Etotal ˃ Utotal), at least one of the BPVs has an error more than the estimated uncertainty.
Probable cases of anomalies. The totals errors in the calibration result (Eq. 4) can be positive or negative. In the event of a positive error (i.e., BPVa + BPVb – BPVc – BPVd ˃ 0, if Etotal ˃ Utotal (i.e., BPVa + BPVb – BPVc – BPVd ˃ Utotal), this can be an instance of inconsistency where BPVa and/or BPVb have an error/offset beyond the estimated uncertainty on the positive “+” (i.e., Ea ˃ Ua, Eb ˃ Ub), or BPVc and/or BPVd have an error/offset beyond the estimated uncertainty on the negative “–“ (i.e., –Ec ˂ –Uc, –Ed ˂ –Ud).
Similarly, for a negative error (i.e., BPVa + BPVb – BPVc – BPVd ˂ 0) if Etotal ˃ Utotal (i.e., BPVa + BPVb – BPVc – BPVd ˃ Utotal), this is an instance of inconsistency where BPVa and/or BPVb have an error/offset beyond the estimated uncertainty on the negative “–“ (i.e., –Ea ˂ –Ua, –Eb ˂ –Ub) or BPVc and/or BPVd have an error/offset beyond the estimated uncertainty on the positive “+” (i.e., Uc ˂ Ec, Ud ˂ Ed).
An illustration of one probable instance of positive error is provided in FIG. 5 for BPVA. As shown in the figure, the true value of BPVA is beyond the estimated uncertainty in BPVa (i.e., Ea ˃ Ua), but the error in the other BPV is within estimated uncertainty.
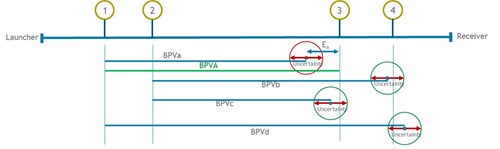 |
| FIG. 5. BPVa error > the estimated uncertainty. |
Analysis of typical calibration results. The recalibration results of a 30-in. bidirectional prover of a nominal base prover with an 84-bbl volume (13.35 m3) using the water draw method is provided in TABLE 2. The prover had four detectors and four independent BPVs were derived.
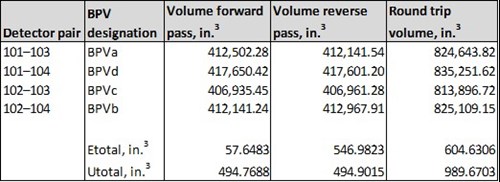 |
| TABLE 2. Recalibration results |
The uncertainty in the BPVs was estimated to be 0.03% after considering all factors that would impact and result in the spread of the derived volume in consideration. The Etotal of all BPVs in the forward direction was 57.64 in.3, which is within the Utotal of 494.7688 in.3. The Etotal of all BPVs in the reverse direction was 546.9823 in.3, which is more than the Utotal of 494.9015 in.3. This is an incidence of inconsistency where either BPVa and/or BPVb have an error/offset beyond the estimated uncertainty on the positive “+” or BPVc and/or BPVd have an error/offset beyond the estimated uncertainty on the negative “–“. The comparation of derived BPVs with previous calibration data indicated that BPVb had error larger than estimated and required recalibration.
Caution. The method described here helps identify that at least one BPV has an error beyond the acceptable limit. It should be noted that errors in BPVA or BPVB are nullified by an error of the same sign in BPVC or BPVD. Therefore, there can be instances when even the total errors are less than the totals of estimated uncertainty—two or more BPVs have errors beyond acceptable uncertainty. The method described here does not replace the requirement of scrutinizing results in all aspects, including comparing results with past calibration records.
Takeaways. This paper details an approach to identify the existence of inconsistencies, if any, in four BPVs derived during the calibration operation of a prover using water draw or any other method where the calibration of the prover is performed independently for each pair of detectors. The method described is for a prover with four detectors, but the concept can be extended if the prover has more than four detectors. GP
NOTE
The suggestions and guidelines provided in this article should be considered general in nature. Readers are encouraged to refer to relevant codes and standards by legal metrology and other institutes.
LITERATURE CITED
- American Petroleum Institute (API) Manual of Petroleum Measurement Standards (MPMS) 4.2, “Chapter 4—Proving systems; Section 2—Displacement provers,” September 2003.
- American Petroleum Institute (API) Manual of Petroleum Measurement Standards (MPMS) 4.8, “Chapter 4—Proving systems; Section 8—Operation of proving systems,” September 2013.
- American Petroleum Institute (API) Manual of Petroleum Measurement Standards (MPMS) 12.2.4, “Chapter 12—Calculation of petroleum quantities; Section 2—Calculation of petroleum quantities using dynamic measurement methods and volumetric correction factors; Part 4—Calculation of Base Prover Volumes by the Water draw Method” March 2009.
 |
Chandulal N. Bhatasana is the Chairman of the Custody Measurement Standards Committee at Saudi Aramco and has more than 30 yr of experience in custody/fiscal metering and instrumentation. Bhatasana has authored several papers and received patents on innovative techniques related to proving systems in custody metering. He holds a BS degree in engineering. The author can be reached at Chandulal.bhatasana@aramco.com (office) or chandu_bhatasana@yahoo.com (personal).


Comments