
Agile approaches for transitioning to quantitative risk assessment modeling—Part 2
Part 1 of this article appeared in the August issue.
Pipeline operators are increasingly transitioning their pipeline risk assessment approaches to more objective, quantitative risk models that provide for improved decision-making, better ability to manage risk levels to acceptability targets and, ultimately, support their integrity programs to eliminate high-impact events. Many operators have existing relative index-based risk ranking models that, although characterized as “qualitative” in terms of the risk output, utilize a significant amount of data that could also support a more quantitative expression of risk.
Industry trending in pipeline risk modeling also indicates regulatory, standards and stakeholder alignment with an expectation for more objective, quantitative approaches and measures that can be used with risk acceptance criteria to demonstrate safe pipeline operations more clearly. In some regulatory jurisdictions (e.g., Europe) and other high-consequence industries (e.g., chemical manufacturing, aerospace and nuclear), such guidelines already exist. Part one of this article (August 2022) discussed quantitative risk assessment results that are more useful and actionable in application with, and comparison to, defendable risk acceptance criteria.
Consequence modeling. For consequences, many operators have preferred to retain indexing to avoid the sensitive nature of accounting for safety consequence as a dollar value and to provide for a means of combining all consequences. While this approach still provides for risk-based prioritization, it does not provide for a full quantification of the risk to support effective decision-making. The U.S. Department of Transportation (DOT) provides a value for a statistical life that is updated annually, which can be used as a defensible safety consequence dollar value starting point.9 Inherently, both environmental and economic consequences are dollar values and the conversion from a relative index-based model to a quantitative model is relatively straight-forward.
Some typical approaches for assessing the consequences of failure quantitatively include:
- Safety: Approaches for liquid or gas releases consider the calculation of a hazard area (flammable, toxic or asphyxiating) and overlay with population density. The safety consequence can be expressed as societal risk or individual risk. This can be quantified in terms of dollars by leveraging published estimates for the value of human life.
- Environmental: Approaches for liquid releases consider the potential liquid spill volume from a release (both pre-isolation and drain-down volume) and the sensitivity of the receptor. This can be quantified in terms of dollars by leveraging published estimates for clean-up costs and socioeconomic impacts. Gas releases should include greenhouse gas considerations as well as potential receptors damage if the release is ignited.
- Economic: Approaches for financial impacts consider product loss costs, repair costs, public damage and outage impacts. Other impacts that may have a cost impact include reputation and regulatory.
Final risk calculation. When combining the failure likelihood and consequence results for the risk assessment, it is important to understand the end goal of the risk assessment and the risk profile presentation that is required for stakeholder decision-making. Multiple stakeholders often have different desired reporting formats due to their different objectives. For example:
- Is a profile of total risk needed (i.e., mustall consequences be brought to a common unit, such as dollars,so they can be combined)?
- Can separate profiles of safety risk (fatalities/mi.-yr), environmental risk (impact adjusted spill volume/mi.-yr) and economic risk ($/mi.-yr) be effective for targeted risk reduction?
These considerations will impact how the risk model is designed and applied.
Risk evaluation. As part of the risk managementprocess, it is necessary to determine the significance of the measured risk level. This requires a check against established risk acceptance criteria. Such criteria may be represented by areas of a risk matrix (e.g.,a corporate risk matrix) where actions are required,or by more specific, robust broadly acceptable, intolerable and associated ALARP (as low as reasonably practicable) region limits.
EVALUATION AGAINST A CORPORATE RISK MATRIX
As part of the risk evaluation process, it is often a requirement to present and evaluate risk results in the context of a corporate risk matrix that may be more ideally suited to point assets (e.g., facilities)rather than linear assets (e.g.,pipelines). While presenting quantitative risk results within the traditional risk matrix may not be the most effective representation (i.e., compared to representations on a plot with specific risk acceptance thresholds),it is acknowledged that stakeholders may require such a presentation of results for their overall understanding of the risk profile for an asset set.
Many corporate risk matrix descriptors often have underlying quantitative factors or can imply certain quantitative reliability or consequence levels, making it possible to apply a general mapping of results to the corporate risk matrix. FIG. 10 presents an example of a corporate risk matrix with qualitative failure likelihood, consequence and risk levels. The required actions for the various risk levels are often pre-defined.
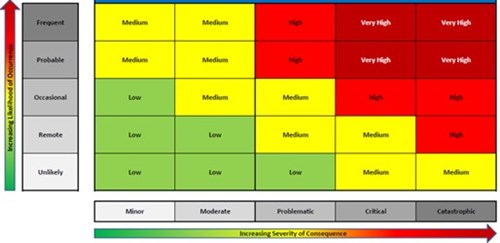 |
| FIG. 10. Example of corporate risk matrix. |
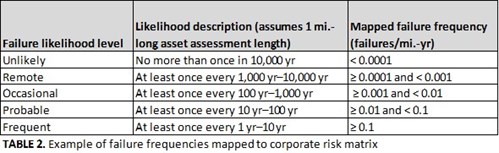
Typically, such a matrix would have underlying descriptors that set thresholds for both the failure likelihood and consequence levels, as shown in the examples in TABLES 2 and 3.
 |
 |
Step 1: Mapping failure likelihood. Convert the corporate risk matrix likelihood description to a failure frequency per unit length (i.e., failures/mi.-yr):
-
It is necessary to relate these likelihood descriptions to an equivalent linear pipeline asset with a reasonable assessment length (i.e., 1 mi. is assumed in the TABLE 2 example).
-
If other asset assessment lengths are assumed, the mapped failure frequencies should be adjusted accordingly.
Step 2: Mapping consequence of failure. Map the consequence levels based on the severity categories and descriptions:
-
Safety: In this corporate risk matrix example, fatalities commence at the “critical” level and multiple fatalities commence at the “catastrophic” level.
-
Environmental: In this corporate risk matrix example, the spill impact dollar estimates from spill impact modeling are aligned with the impact, remediation and spill volume descriptors.
Step 3: Calibration and benchmarking. Test the mappings by performing initial checks on benchmark pipelines in the systemto ensure the results are reasonable. This test for reasonableness may include:
- Checking the required response from the risk matrix against current integrity plans
- Checking the distribution of line segment risk results across the risk matrix cells
- Checking the actual historical failure/loss data against the implied risk from the risk matrix mappings.
Evaluation against risk acceptance limits. It should be noted that the evaluation and presentation of quantitative risk results at the segment level (typically no longer than 1 mi.) applied in combination with defendable risk acceptance thresholds represents the most effective and granular means of identifying actionable segments for risk reduction at the integrity management level, as outlined in FIG. 11.
 |
| FIG. 11. Evaluation and presentation of quantitative risk against acceptance criteria. |
A summary of the ALARP concept is presented in FIG. 12. The triangle represents the decreasing risk and the diminishing proportional benefit as risk is reduced.
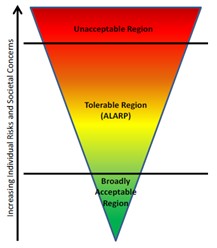 |
| FIG. 12. The ALARP concept10 |
Risk control. The goal of quantitative risk assessment is to provide for informed, risk-based decision-making to support integrity management activities and prioritizations. It is acknowledged that risk assessment and integrity management approaches may not always be fully aligned and that calibrating and gaining trust in the risk assessment results across the organization is a journey—a necessary one to ensure that regulatory and stakeholder expectations to integrate risk results into integrity management decision-makingare satisfiedandthat, ultimately,high consequence events are eliminated.
A framework for the integration of quantitative risk assessment and risk control into anintegrity management plan is outlined in FIG. 13. The key elements of this integration include:
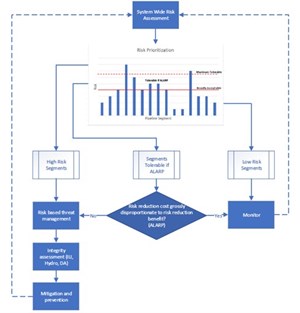 |
| FIG. 13. Integration of risk assessment and risk control |
- Compare the calculated risk to established risk limits
- Prioritize preventative andmitigative(P&M) activities
- Reduce failures and move company risk towards target levels.
Change management. Once the commitment has been made to move to a quantitative risk assessment program, it is critical to mobilize that commitment in anorganized and structured manner to maximize the program’s adoption. Although individual elements may vary, a successful quantitative risk model transition is essentially comprised of three elements: people, processes and tools:
- People: A successful risk assessment programinvolvesa team of various disciplines organized aroundthe overall objective to manage and control the pipeline operator’s exposure to potential pipeline failures.
- Processes: Corporate standards or operating proceduresdetail the risk assessmentprogram and processes to be followed.
- Tools: Tools designed to manage the risk program, such as software or GIS databases, support the team to manage pipeline risk.
The inter-relationship of these elements is critical to the overall success of the risk assessment program. For example, having industry-leadingrisk modelsor the latest technology will not be effective if the necessary team structure is absent. Therefore, a successful transition must consider each of these elements and provide a complementary environment that results in more efficient, consistent and reliable risk assessments.
Key areas for consideration in the change management process include:
- Standard operating procedure updates: Ensure the alignment in integrity management principles.
- Training: Ensure the awareness, competency and efficiency in the application of the quantitative risk approaches.
- Data management: As data becomes an asset to the organization, asset management principles should be applied.Speciality data sets that may have been shared within a limited audience must be governed by agreed-upon standards as they are utilized by alarger community.
- Reporting: Stakeholder communication has been described within this paper: as the results become more quantitative,additional considerations should be given to how these are communicated in a meaningful manner. Risk results may change as the models evolve,which often requires clarification and justification of the differences.
Takeaways. Pipeline operators are increasingly transitioning their pipeline risk assessment approaches to more objective, quantitative risk models that provide for improved decision-making, an increased ability to manage risk levels to acceptability targets and ultimately support their integrity programs to eliminate high-impact events. Industry trends for pipeline risk modeling also indicate regulatory, standards and stakeholder alignment with an expectation for more objective, quantitative approaches and measures that can be used with risk acceptance criteria to demonstrate safe pipeline operations more clearly. Successfully implementing the transition to quantitative risk assessment requires an agile plan and roadmap, key stakeholder engagement, a risk communication strategy and alignment of integrity planning activities to best leverage the new risk assessment outputs.
To minimize project risks, an agile development program—allowed to adapt as information and priorities inevitably change—has been presented.Agile project management is an iterative approach that focuses on breaking down large projects into more manageable tasks that are completed in short iterations throughout the project lifecycle and lends itself to the quantitative risk assessment transition.
It is important to define, in advance, the objectives of the risk assessment to ensure that the quantitative risk assessment transition roadmap and framework support these objectives. With the quantitative risk assessment objectives in mind, a high-level roadmap for quantitative risk assessment implementation has been developed and presented in both parts of thisarticle (Part 1 was published in the August issue of GP&LNG). Several options for quantitative risk modeling have been presented with associated examples, including failure frequency approaches (using incident data), reliability approaches (based on limit states), “like-in-kind” approaches (data from similar pipelines) and fault trees for estimating the likelihood of failure. More recent developments include machine-learned Bayesian networks and regression modeling. The approaches for evaluating quantitative risk results within a corporate risk matrix or against acceptability limits and the integration of risk results into the integrity management plan for risk control measures have also been discussed.
Through change management, a successful quantitative risk assessment transition considers the critical elements and inter-relationships of people, processes and tools to support the continuous improvement of the risk assessment program. GP
NOTE
This article was presented at the International Pipeline Risk Management Forum, November 2021. Copyright ©2021 Clarion Technical Conferences and the authors. Used with permission.
LITERATURE CITED
- U.S. DOT PHMSA Final Report No. 16-092, “Paper study on risk tolerance criteria,” June 30, 2016.
- “Proposed changes to Canadian Standards Association (CSA) Z662:23 Standard: Oil and gas pipeline systems, Annex B,” 2021 Banff Pipeline Workshop, Banff, Alberta, Canada, April 6–15, 2021.
- WG7 Session D, Banff Pipeline Workshop 2019, Banff, Alberta, Canada, April 8–11, 2019
- U.K. Health and Safety Executive (HSE), online: https://www.hse.gov.uk/index.htm
- CSA Z662 Risk Management Task Force.
- Canadian Standards Association (CSA) Z662:19 Standard, “Oil and gas pipeline systems,” 2019.
- Agile Alliance, online: https://www.agilealliance.org/agile-essentials/
- Quote attributed to British statistician George E.P. Box, who worked in the areas of quality control, time-series analysis, design of experiments and Bayesian inference.
- American Society of Mechanical Engineers, ASME B31.8S, “Managing system integrity of gas pipelines,” 2020.
- EN 1990:2002 E, “Eurocode—Basis of structural design," CEN, November 2001.
 |
KEVIN SPENCER has more than 20 yr of experience in the global pipeline integrity industry. He is a subject matter expert (SME) specializing in enterprise integrity management systems, risk and reliability, and in-line inspection (ILI) technologies. Mr. Spencer has previously worked for global technology service providers across product management, account development and technology departments. As the Director, Client Partnerships at Dynamic Risk, Mr. Spencer provides leadership in nurturing and growing a strong and responsive client relationship team focused on providing advanced technology and tech-enabled services to manage critical pipeline infrastructure. He is also actively involved with a variety of industry associations through committee participation and speaking engagements and sits on the CSA Integrity Task Force. Kevin holds a BS degree in applied mathematics and statistics from the University of Newcastle Upon Tyne, UK.
 |
DAN WILLIAMS is a licensed professional engineer with a B.E.Sc. degree in materials engineering and has more than 25 yr of combined experience in pipe manufacturing and pipeline integrity. Mr. Williams is a Principal Consultant at Dynamic Risk, where he is responsible for providing technical leadership in pipeline engineering assessment and risk management services.


Comments