Agile approaches for transitioning to quantitative risk assessment modeling—Part 1
Pipeline operators are increasingly transitioning their pipeline risk assessment approaches to more objective, quantitative risk models that provide for improved decision-making, better ability to manage risk levels to acceptability targets and, ultimately, support their integrity programs to eliminate high-impact events. Many operators have existing relative index-based risk ranking models that, although characterized as “qualitative” in terms of the risk output, utilize a significant amount of data that could also support a more quantitative expression of risk.
Industry trending in pipeline risk modeling also indicates regulatory, standards and stakeholder alignment with an expectation for more objective, quantitative approaches and measures that can be used with risk acceptance criteria to demonstrate safe pipeline operations more clearly. In some regulatory jurisdictions (e.g., Europe) and other high-consequence industries (e.g., chemical manufacturing, aerospace and nuclear), such guidelines already exist.
Risk acceptance guidelines for the North American pipeline industry are either being explored [Pipeline and Hazardous Materials Safety Administration (PHMSA)]1 or developed [Canadian Standards Association (CSA) Z662].2 Note: On October 1, 2019, the PHMSA finalized a rule for gas transmission pipelines that had been in development for more than 8 yr. The effective date is designated as July 1, 2020. This highly anticipated rule, referred to by many as the “Gas Mega Rule,” is considered the most significant change to the existing gas pipeline regulations since 1970 and is likely to have a significant impact on the operation of gas transmission assets in the U.S. The rule is split into three parts: two focus on changes to safety standards that apply to gas pipelines and hazardous liquid pipelines, while the third changes the procedures required to issue emergency orders.
Some operators are also applying their own criteria as informed by guidelines in other pipeline jurisdictions (e.g., the UK, the Netherlands) or existing reliability-based guidelines, such as those in CSA Z662 Annex O. These trends acknowledge that quantitative risk assessment results are more useful and actionable in application with, and comparison to, defendable risk acceptance criteria.
Quantitative risk assessment background and trending. As outlined in FIG. 1, pipeline risk modeling can be viewed as a continuum with qualitative (or more subjective) methods on one end of the continuum and quantitative (or more objective) methods on the other end. As part of the risk modeling continuum, the aim is to quantify the risk in the most objective manner. This is the far right of the continuum—objective modeling estimates (approaches) with a quantified risk measurement that can be directly compared against risk acceptance criteria. This is the target area of the continuum for driving the continuous improvement of pipeline risk modeling.
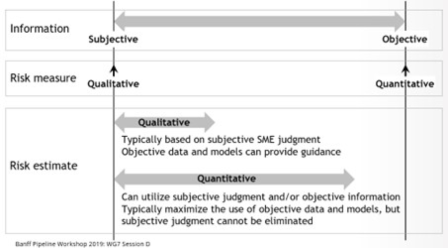 |
| FIG. 1. Pipeline risk modeling continuum.3 |
While relative index-based or qualitative risk assessment can and has played an effective role in risk-based prioritization and screening, such approaches are limited because they only have context within the specific pipeline system being assessed. The ultimate aim is to transition from more subjective, qualitative or relative index-based expressions of risk (as shown in FIG. 2), to more objective, quantitative expressions of risk that can be compared against industry-recognized broadly acceptable and intolerable risk thresholds (as shown in FIG. 3). In this way, the quantitative expressions of risk can have meaning within a broader industry-wide context and more clearly demonstrate the pipeline safety level to stakeholders.
 |
|
FIG. 2. Relative index-based or qualitative risk matrix.5 |
 |
|
FIG. 3. Quantitative risk matrix with acceptance boundaries defined.5 |
The concept of ALARP (as low as reasonably practicable) is also introduced in FIG. 3. Risk results within the “broadly acceptable” area of the matrix would not require additional risk reduction measures; results within the “intolerable area” would require risk reduction measures; and results within the “tolerable if ALARP” area would only require risk reduction measures if it cannot be demonstrated that the risk reduction efforts are grossly disproportionate to the risk reduction achieved (i.e., through a cost-benefit analysis).4
From a U.S. perspective (outside of system-wide risk assessments), with the release of Part 1 of the Gas Mega Rule1 in October of 2019 (effective July 1, 2020), along with pending class location designation change rulemaking and Part 2 of the Gas Mega Rule, operators will potentially benefit from incorporating quantitative risk assessments as part of engineering critical assessments (ECAs) and advanced fitness-for-service solutions for validating and reconfirming maximum allowable operating pressure (MAOP), special permitting for class location designation changes, and varying from prescriptive response and repair requirements. From a Canadian perspective, operators will continue to be guided by the CSA Z662 requirements6 to apply engineering assessments (EAs), which require the consideration of risk assessment, for demonstrating safe pipeline operations. The application of risk acceptance criteria, such as those proposed for the CSA Z662:23 Standard, will support a strategic framework for improving pipeline safety and the use of quantitative risk assessment results (i.e., in comparison to risk acceptance thresholds) within an EA. These performance-based assessments will ensure that resources are focused on efforts that measurably improve pipeline safety and reliability performance and that pipeline replacement, pressure reduction and pressure testing actions are efficiently directed.
Successfully implementing the transition to quantitative risk assessment requires an Agile plan and road map, key stakeholder engagement, a risk communication strategy and the alignment of integrity planning activities to best leverage the new risk assessment outputs.
QUANTITATIVE RISK ASSESSMENT TRANSITION ROAD MAPPING
As an initial step, it is important to define the goals and objectives of the risk assessment to ensure that the quantitative risk assessment transition road map and framework support these key requirements. Some key objectives of risk assessment include:
- Use the risk results to inform integrity management prioritization
- Highlight pipeline segments where the risk is high (beyond an acceptance threshold) or increasing
- Support risk management:
- Consider risk reduction options and calculate the benefit of risk mitigation activities
- Support decision-making and program development
- Minimize risk to ALARP and eliminate high-impact events
- Improve system reliability
- Identify gaps or concerns in data quality and completeness.
With quantitative risk assessment objectives in mind, a high-level road map can be developed (FIG. 4) that identifies some of the key stages and considerations. These stages are described in more detail in subsequent sections.
| FIG. 4. Quantitative risk assessment road map. |
An Agile approach. The road map presented in FIG. 4 identifies the key components for the quantitative risk model transition—these intrinsically interdependent elements do not necessarily connect in such a linear manner. This creates project risks that require a flexible development program that is allowed to adapt as information and priorities undoubtedly change, ultimately leading to a higher quality product.
Agile project management is an iterative approach to project management that focuses on breaking down large projects into more manageable tasks that are completed in short iterations throughout the project lifecycle. The Agile methodology has its roots in software development,7 but the principles are relevant to a broad range of applications and certainly transferable into quantitative risk model development. Agile approaches require discipline to adopt and, when applied inconsistently, can lead to misinterpretation or deviation from the intent. The importance of effective project management cannot be overstated in aligning risk team members and stakeholders to achieve a successful quantitative risk assessment transition.
The antithesis of Agile is the “waterfall” approach, whereby the scope is essentially fixed and defined up front. In this scenario, requirements (risk approach or model) are defined by the subject matter experts (SMEs) and then provided to the project team [e.g., software developers, geographic information system (GIS) specialists] to implement. As the complexity of the project increases, the weaknesses of this approach become apparent. In this scenario, delivery and testing occur toward the end of the project, so there is immense pressure on the SME to produce robust requirements and consider all permutations and scenarios, as changes are difficult to implement mid-project. Quite often, the SMEs are ear-marked to be utilized elsewhere and cannot accommodate unplanned and significant time commitments if issues occur. In terms of risk modeling, as the variability of the system increases, [e.g., pipeline location (offshore, onshore, buried, above ground), product transported, available inspection data (piggable vs. unpiggable), and different combinations thereof], an Agile approach will enable unplanned model variations to be added into the project backlog and prioritized appropriately.
One challenge with an Agile methodology is that it requires a dedicated team—this can be difficult to achieve when relying on SMEs that are often an in-demand resource. While the goal may be known, the scope is essentially estimated and only broadly defined at the project’s beginning; this can be difficult to communicate to stakeholders and often leads to a somewhat hybrid approach in practice. Overall, the true benefit of an Agile approach for transitioning to quantitative risk assessment is a better-quality deliverable with a team that is committed and aligned to the goal. The project manager’s objective is to mobilize this commitment and remain true to the goal despite potential internal pressures. Road map elements are considered here.
Risk workshop. Initial workshops provide an excellent forum to gather all stakeholders to discuss the objectives of the quantitative risk implementation. The goals of the workshop are to raise awareness and enable a successful transition, identify key resources, support data collection efforts and understand what is available, and improve overall project quality.
Bringing together relevant operations and integrity personnel allows specific threats or consequences to be discussed in detailed breakout sessions. It has been the authors’ experience that engagement at these workshops is high, and the consideration of quantitative risk assessment within an overall risk management program provides an opportunity to see how individual elements or departments are integrated for the ultimate and common goal of safe, efficient, effective and incident-free pipeline operation. Organizational challenges such as siloed data management should be addressed during this workshop with an emphasis placed on the ability to access data in a timely manner.
Data inventory. All quantitative risk assessment roads are paved with data and a successful transition is dependent on a robust data strategy. The quality of the data has a direct impact on the quality of any analyses, assessments or decisions made using that data. Many operators already have an enterprise GIS system that is used as the system of record for pipeline data and can be augmented with additional data streams to provide inputs to the risk assessment. For an operator without a GIS system, other options are available; however, the risk assessment is predicated on accessing data in a structured and consistent format and even simple databases (e.g., spreadsheets) can work, although they can become cumbersome and potential sources of error as complexity increases.
Data uncertainties should also be addressed during this phase. Data attributes that are traceable, verifiable and complete (TVC) can be identified and recorded, and other data attributes interrogated for their veracity. The accuracy and precision of measured values should be documented and, if unknown, may be available from vendors or industry databases (e.g., wall thickness variations). Data quality characterizations developed during this stage can potentially be leveraged later during the model development stage through the incorporation of uncertainty factors and considerations (e.g., data quality flag).
Risk backlog. A backlog is an ordered list of work items to complete the development. The risk backlog is prioritized by the project manager. As the project progresses, tasks that are most important will move to the top of the backlog while those that can be completed later are pushed to the bottom. The backlog includes all elements of the project, which may then be further broken down into smaller “stories.” This concept is expanded upon in subsequent sections of this paper.
Quantitative modeling. Several approach options are available for quantitative risk modeling including (but not limited to): reliability approaches (based on limit states), failure frequency approaches (using incident data), “like-in-kind” approaches (data from similar pipelines) and fault trees for estimating the likelihood of failure. More recent developments include exciting initiatives related to the use of machine-learned Bayesian networks, and regression modeling for effectively estimating the likelihood of failure from threat-relevant factors and associated data. On the consequence side, the use of digitized structure information and occupancies along the pipeline system for safety considerations and the use of detailed outflow and overland spill modeling analysis for environmental considerations also lend themselves to a more robust approach.
Technology implementation. Consideration should be given to any technology requirements to manage the proposed quantitative approach effectively and efficiently. Technology should be defined as any tool designed to support the quantitative risk assessment and can include GIS systems, risk assessment software or reporting dashboards. Technology requirements should be aligned to support the objectives and will vary depending on the size and complexity of the program.
Calibration. A key step in the development of the quantitative risk model is calibration against relevant historical failure information or observed conditions to ensure the results do not significantly conflict with operating history realities. This is particularly relevant when different models and approaches are used that can introduce undesirable artifacts when compared against each other. Risk models should not be considered complete until calibrated during the model development. The project team should consider the existing risk process and how models will be incorporated. This can avoid unnecessary missteps related to regulatory or corporate timelines conflicting with the development schedule, as well as unconscious biases—prejudice or unsupported judgments in favor of or against one thing—during initial model implementations.
Risk-informed data approach. As previously stated, a successful transition is dependent on a robust data strategy. It is likely that new data elements are identified for incorporation into the quantitative risk assessment. If these are not readily available, the risk analysis can be utilized to inform the data strategy (i.e., identify gaps or concerns in data quality and completeness and the potential impacts associated with these uncertainties).
Model refinement. In the spirit of Agile approaches, a “progress over perfection” risk modeling philosophy allows for continued improvements to the risk model. A pragmatic and proven approach is to put the risk model “through its paces” with an operational data lens of the subject system. The resulting risk results and proposed mitigative steps will typically generate both model and data improvements for future iterations. A model scorecard has been useful in objectively defining “done” and avoiding the potential project bottleneck of model iterations. Scorecard categories can include.
- Credibility: Documented basis of algorithm methodology, data inputs and quality
- Versatility: Applicability to a wide range of data availability and quality
- Calibration: Results are tested against relevant historical failure information
- Actionability: Results support high-quality decisions across a range of stakeholders.
Risk backlog prioritization. As previously mentioned, the risk backlog details the list of work items to be completed. The backlog includes all elements of the project, which may then be further broken down into smaller “stories.” For example, a risk backlog item might be “external corrosion,” which is then further broken down to smaller stories (e.g., determine threat factors, confirm data availability, develop data collection approach, identify candidate quantitative models, develop model, etc.). Stories are organized into “sprints,” which are fixed-length events (2 wk–4 wk), during which the work occurs (i.e., stories are completed) (FIG. 5).
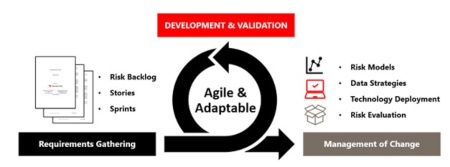 |
| FIG. 5. Agile approach. |
Some considerations for developing the risk backlog include:
- Gather requirements through threat and consequence assessment and data workshops
- Threats
- For a quantitative approach, all threats should ideally be considered, and the results will indicate those threats that can be considered inactive—it may be that some models can be initially omitted with thorough justification and documentation
- Threat factors and data availability/quality
- Identification of the “good/bad/ugly” of current models
- Conduct SME interviews
- Identify applicable preventative and mitigative measures
- Determine appropriate limit states
- Consequences
- Failure modes considered
- Hazard areas and consequence receptors (safety and environmental)
- Financial and reputation
- Threats
- Map data sources and prepare data (including application of data quality assessment tools)
- Data quality and accuracy measurement
- Data completeness and coverage
- Conflicting or missing data logic
- Identify candidate models for quantifying threats and consequences, including key model factors
- Develop model and run iterations
- Calibrate and validate results
- Backlog model refinements
- Risk evaluation
- Establish acceptance criteria and compare results against those criteria:
- Regulatory
- Corporate
- Reporting and communication
- Establish acceptance criteria and compare results against those criteria:
- Management of change (MoC)
- Technology requirements
- Training
- Standard operating procedure (SOP) updates
- Stakeholder communication plans.
For quantitative risk assessment development, many of the stories will be similar across threats and are usually worked on simultaneously. Although it can appear daunting at first, the scalable backlog/stories/sprint concept articulates an organization’s vision and is a useful communication tool to stakeholders. The following sections describe the foundational elements of risk management (analysis, evaluation and control) and the consideration required in quantitative approaches that are used to inform the development of the risk backlog.
QUANTITATIVE RISK ASSESSMENT MODELING APPROACHES
A key consideration in transitioning from qualitative to quantitative risk assessment is that it is not a matter of “starting from scratch.” Many of the relevant data elements may already be in place, such as threat susceptibility factors, assessment information [e.g., excavation results, in-line inspection (ILI) data] and consequence considerations (e.g., population densities along the pipeline and overland spill estimates). Most existing qualitative risk models are no longer purely SME-based but have significant quantitative elements in the approach, such as remaining life determinations from ILI data, defect growth considerations, hazard area calculations overlaid on population densities and spill volume estimates.
However, the ultimate risk measure or output may be in the form of a relative index. As such, the challenge is more around, “How do we use the available data to quantify the risk?” rather than, “How do we get more data to quantify the risk?” Opportunities will certainly be identified along the transition journey for achieving more granular data that will only improve the objectiveness of the risk assessment. However, this does not become a “show-stopper,” and risk model sensitivity analyses can be applied to help support the prioritization of data collection initiatives to ensure the most relevant and impactful data is applied in the modeling and that resources are appropriately assigned.
Risk assessment of a pipeline system must include a sound theoretical component wherein all relevant information (e.g., pipeline-specific, relevant industry-wide and subject matter assessment data) about the pipeline health is analyzed. This will support pipeline operators in determining and mitigating the high-risk elements of the pipeline system as well as maintaining acceptable levels of reliability and safety. Operators have been discussing and embarking on a transition from relative index-based to quantitative risk modeling for many years. Historically, there has been apprehension related to making the transition due to perceived data requirements and a lack of confidence in existing modeling. After all, it has been said, “All models are wrong, but some can be useful.”8 This recognizes that a model will never represent the exact present or future condition of an asset, but it can be very helpful if it is close enough. Several options to achieve quantitative risk modeling can leverage existing models with the goal of incorporating more quantitative approaches and data as the baseline model matures.
Industry failure rate adjustment. One of the most direct means of adapting an existing relative index-based model into a quantitative model is through a failure statistics approach that applies an adjustment algorithm to the industry failure rate data that reflects system-specific threat factors. The adjustment algorithm can leverage the existing relative index-based models for each threat. For instance, a relative index-based model is commonly scaled from 0–10 on both the threat and consequence sides of the risk equation, resulting in risk scores on a scale to 100. Threats considered are based on those referenced in industry standards [e.g., typically nine, such as those referenced in the American Society of Mechanical Engineers (AMSE) Standard B31.8S9] and individual consequences (typically three, including safety, environmental and economic). Other industry standards that can be referenced for threat considerations include API 1160: Managing System Integrity for Hazardous Liquid Pipelines and CSA Z662:19 Annex H (Pipeline failure incident records).
For threat alignment with industry failure statistics, the statistics maintained by PHMSA are utilized as a baseline failure frequency. However, the industry data is filtered to reflect, as closely as possible, the system-specific parameters (i.e., product type, operation type and pipe vintage range). To apply the adjustment algorithm to the failure frequencies sourced from the PHMSA incident statistics, it is common to align the midpoint of the adjustment algorithm (relative index score) with the industry average failure frequency associated with a specific threat. From the midpoint, the adjustment algorithm “dials” the industry failure frequencies up or down, with order of magnitude adjustments based on system-specific threat factors.
The exact orders of magnitude can be calibrated to the operator’s system, but a typical approach is to have a range of two orders of magnitude below and above the industry failure frequency that aligns from the minimum to the maximum of the relative index adjustment algorithm. This approach allows an operator to make the transition from a relative index-based model to a quantitative model in a short amount of time with existing models. This provides a baseline quantitative approach that can continuously be augmented and improved with more robust modeling as the model matures and new assessment data is leveraged. An example of this approach is presented in FIG. 6.
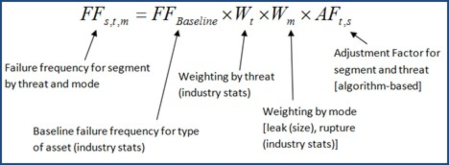 |
| FIG. 6. Example of adjusted industry incident data-based model. |
Fault trees. Fault tree models associated with pipeline risk modeling have existed for decades and are active components in many current quantitative algorithms. Fault trees are analyzed using Boolean Logic that combines multiple series of events that happen in a progressive order to arrive at a final event. Fault tree analysis outlines the relationship between lower-level events that ultimately combine to indicate the likelihood of a full system event happening. “What is the probability that Event A happens given that Events B, C and D have happened?” An example of this approach is presented in FIG. 7.
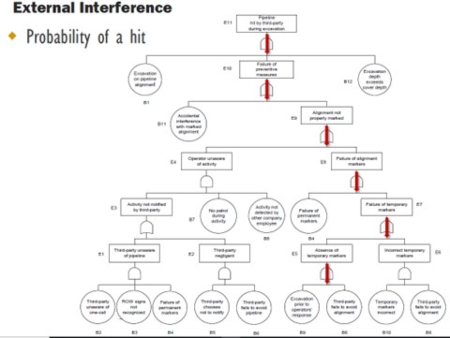 |
| FIG. 7. Example of a fault tree model. |
Probability of exceedance. A key step in transitioning to quantitative risk assessment is leveraging the ILI data already being collected by the operator. ILI data is invaluable when calculating quantitative risk because it provides the most accurate insight into the actual state of the pipeline. The data collected from an ILI tool can be leveraged within probabilistic limit state models2 (reliability models) to determine a probability of exceedance (POE) that is then used to generate estimated failure frequencies for a section of pipe.
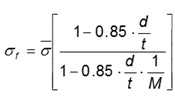
This approach involves calculating a POE for each feature within a defined length of pipe (typically around 1,000 ft) and then combining the probabilities (mathematical OR-gate) for all the features to arrive at a single POE for the defined length of pipe. This POE is then divided by the length of pipe associated with the features to arrive at a failure frequency (failures/m-yr or failures/km-yr). Limit states associated with leak or rupture can be considered, as appropriate. A strength of such models is that uncertainties in pipe attributes and measurements (i.e., errors) are inherently incorporated. An example of a probabilistic limit state model for external corrosion is outlined in FIG. 8. The model:
 |
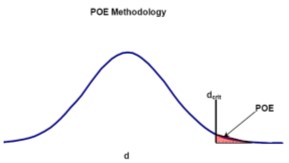 |
| FIG. 8. Example of reliability or probabilistic model. Depth threshold = 80% NWT. |
- Leverages latest magnetic flux leakage (MFL) ILI metal loss data
- Incorporates corrosion growth since time of inspection and consideration of tool error and pipe property variations (i.e., considers uncertainties)
- The growth from run comparisons can be incorporated along with different growth rates for specific parts of the system
- Monte Carlo analysis can be applied
- The Modified B31G equation serves as the limit state equation.
Like-in-kind. As an extension of probabilistic limit state modelling, a “like-in-kind” reliability approach can be particularly useful for difficult-to-inspect (e.g., unpiggable) pipelines or pipelines with limited ILI or excavation data. As an example, system-wide ILI and field data on stress corrosion cracking (SCC) can be leveraged to estimate the SCC threat reliability on other similar (or “like-in-kind”) parts of the system. The system-wide SCC reliability results can be “ported” from inspected pipelines onto similar like-in-kind parts of the un-inspected pipelines after dynamically segmenting the pipeline system based on like-in-kind characteristics. This offers an improvement over the use of industry incident statistics since it applies data from the same operating system and provides an effective means of dealing with ILI data gaps. An example of a like-in-kind reliability approach for SCC is presented in FIG. 9. The like-in-kind group codes, such as “2231,” represent segmented combinations of SCC-specific susceptibility factors.
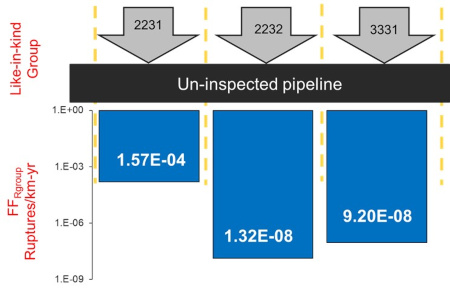 |
| FIG. 9. Example of a like-in-kind reliability model. |
Other approaches. While the incorporation of incident statistic, fault tree and probabilistic limit state modeling techniques has matured within pipeline quantitative risk modeling, it is noted that quantitative risk modeling is not limited to these approaches; additional analytical methodologies are emerging. Two examples of such analytical methodologies are machine-learned regression modeling and Bayesian network modeling.
A general goal of regression modeling is to use relevant data to find an equation by which an output data variable of concern (such as a probability of failure due to external corrosion) could be quantitatively estimated from one or several input data variables (the coating age and type, cathodic protection status, soil type, pipe wall thickness, etc.). Modern regression modeling techniques are also being developed as part of a machine-learning and artificial intelligence (AI) suite of tools for data-driven analysis.
Bayesian network modeling is a term used for a broad spectrum of methodologies, all based on a graphical representation of data variables relevant to risk assessment, where connections among the nodes of the graph denote (generally probabilistic) quantified dependencies among the data variables. Both graphical and quantitative probabilistic content (i.e., connectivity and parameters, respectively) of a Bayesian network can be machine-learned from data, as well as assigned based on SME assessment of the risk domain being modeled and can be applied for line segments which lack ILI data, for example.
A summary of the applications, advantages and potential limitations of the models discussed above is provided in TABLE 1.
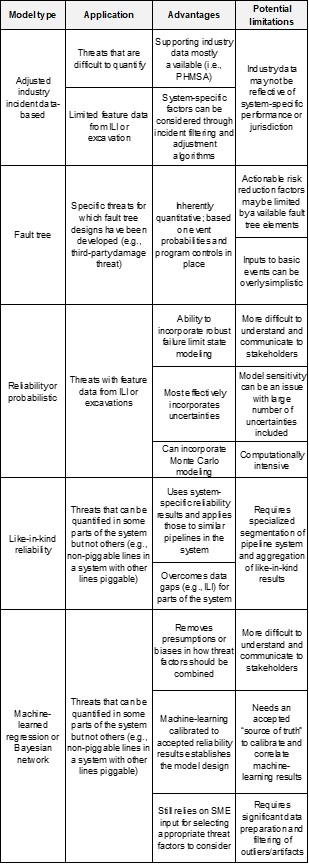 |
| TABLE 1. |
Part 2 of this article will appear in the October issue. GP
NOTE
This article was presented at the International Pipeline Risk Management Forum, November 2021. Copyright ©2021 Clarion Technical Conferences and the authors. Used with permission.
LITERATURE CITED
- U.S. DOT PHMSA Final Report No. 16-092, “Paper study on risk tolerance criteria,” June 30, 2016.
- “Proposed changes to Canadian Standards Association (CSA) Z662:23 Standard: Oil and gas pipeline systems, Annex B,” 2021 Banff Pipeline Workshop, Banff, Alberta, Canada, April 6–15, 2021.
- WG7 Session D, Banff Pipeline Workshop 2019, Banff, Alberta, Canada, April 8–11, 2019
- U.K. Health and Safety Executive (HSE), online: https://www.hse.gov.uk/index.htm.
- CSA Z662 Risk Management Task Force.
- Canadian Standards Association (CSA) Z662:19 Standard, “Oil and gas pipeline systems,” 2019.
- Agile Alliance, online: https://www.agilealliance.org/agile-essentials/
- Quote attributed to British statistician George E.P. Box, who worked in the areas of quality control, time-series analysis, design of experiments and Bayesian inference.
- American Society of Mechanical Engineers, ASME B31.8S, “Managing system integrity of gas pipelines,” 2020.
 |
KEVIN SPENCER has more than 20 yr of experience in the global pipeline integrity industry. He is a subject matter expert (SME) specializing in enterprise integrity management systems, risk and reliability, and in-line inspection (ILI) technologies. Spencer has previously worked for global technology service providers across product management, account development and technology departments. As the Director, Client Partnerships at Dynamic Risk, Spencer provides leadership in nurturing and growing a strong and responsive client relationship team focused on providing advanced technology and tech-enabled services to manage critical pipeline infrastructure. He is also actively involved with a variety of industry associations through committee participation and speaking engagements and sits on the CSA Integrity Task Force. Spencer holds a BS degree in applied mathematics and statistics from the University of Newcastle Upon Tyne, UK.
 |
DAN WILLIAMS is a licensed professional engineer with a B.E.Sc. degree in materials engineering and has more than 25 yr of combined experience in pipe manufacturing and pipeline integrity. Williams is a Principal Consultant at Dynamic Risk, where he is responsible for providing technical leadership in pipeline engineering assessment and risk management services.


Comments