
A competitive study for the behavior of amines in acid gas
Natural gas is the most common fossil fuel. However, because it exists in deep underground reservoirs, it may contain several non-hydrocarbon components [e.g., hydrogen sulfide (H2S) and carbon dioxide (CO2)]. These impurities are undesirable compounds, and can cause several technical problems, including corrosion and environmental pollution.
The Gulf of Suez gas plant—located in the Red Sea region of Egypt—has been operated by the Gulf of Suez Petroleum Co. (GUPCO) since 1983. This plant uses diethanolamine (DEA) for the sweetening process. The facility received a significant amount of natural gas containing acid gas that was beyond the plant’s design conditions. This resulted in corrosion problems and a shutdown of the amine unit, leading to production losses.
Using proprietary process simulation softwarea, plant personnel launched a study aimed at simulating the gas plant’s natural gas sweetening process and examining some of the critical amine process factors for each amine type. This article details this process.
Aim of the study. Natural gas is a vital component in the world’s energy supply. However, despite its importance, there are many challenges when processing natural gas. For example, H2S is a poisonous and extremely corrosive compound that exists in natural gas. Offshore and onshore plants must remove H2S, as government regulations make it mandatory to limit H2S to 4 parts per million (ppm). Over time, various methods for removing H2S have been successful in plant operations; however, industry is always aiming to optimize the removal process and to create a more efficient sweetening process to minimize costs.1
Many different processes have been investigated, but the focus has been to develop a sweetening process by using different kinds of adsorption and absorption methods. When developing gas-sweetening methods, two focus areas are in general use: dry adsorption and wet absorption.2
Dry adsorption is usually a non-regenerative method and consists of a filter where H2S is adsorbed.3 These filters must be changed out regularly to receive the necessary cleaning. Conversely, wet absorption is usually a regenerative process where a liquid stream reacts with the H2S in an absorption column to move it from the gas stream to the liquid stream catalyzed by a chemical reaction.4
GUPCO’s LPG plant treats acid gas with DEA solutions. However, due to corrosion and foaming problems, the plant studied switching from DEA to methyl DEA (MDEA) or another amine. To investigate which natural gas sweetening method worked best, one process was chosen and evaluated thoroughly to evaluate the efficiency of that specific cleaning method. The aim of this study was to determine the most efficient gas sweetening process, using proprietary simulation softwarea. Once the process had been identified, an economic analysis was conducted to ensure that the chosen model is realistic to use.
Process description of the existing gas plant. The operating conditions of rich acid gas feed to the unit include the following:
• Flowrate: 12 MMft3d
• Feed gas temperature: 41°C (105.8°F)
• Feed gas pressure: 49 kg/cm2
• Concentration of H2S feed to the contactor: 600 ppm
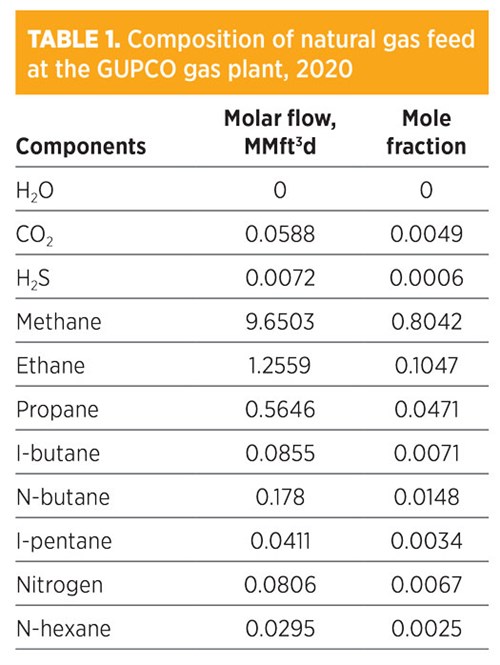
TABLE 1 provides the 2020 composition of the natural gas feed to the amine unit at the GUPCO gas plant, while the process is shown in FIG. 1. The acid gas enters the absorber from the bottom, while the amine solution enters from the top. The amine is made to be reused by passing it through a mixer where it is mixed with a makeup stream of water.
 |
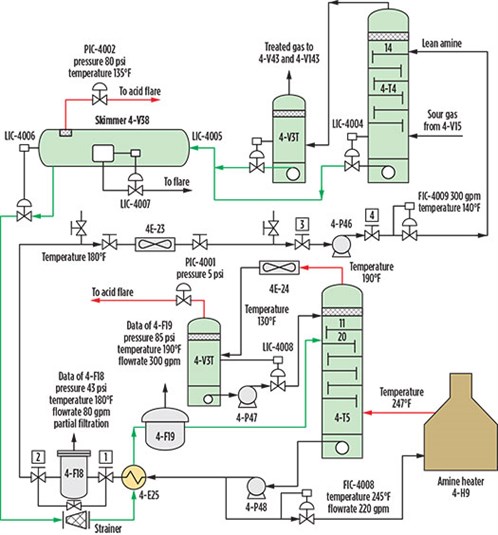 |
| FIG. 1. Process flow diagram of the amine unit at the GUPCO plant. |
Additional amine solution may be added to the mixer to ensure the optimal composition for gas sweetening. A booster pump increases the pressure to 47 bar, which is the operational pressure of the absorber. A heat exchanger was installed to cool the amine solution to the desired operational temperature of 47.3°C (117.14°F). The sweetened gas from the absorber is sent to the pipe transportation system to be transported to a chilling area for distribution and further processing. The bottom liquid leads to a flash tank, where the stream is heated to flush out most of the hydrocarbon content in the stream. The amine solution then heads to a distillation tower (stripper), where H2S is removed to the same level as the sweetened gas. The recovered amine is then added with water in the mixer to reuse for the new sweetening process cycle.
Simulation model. To model a realistic gas sweetening process, a specified content of CO2 must be present. This ensures that the sweetening agent’s efficiency and flow are modeled correctly. The normal accepted content of CO2 in the untreated natural gas should be 4 mol%–5 mol%.5 In addition, the content of CO2 in the natural gas stream was 0.0049 mol%. Therefore, water was added to the amine solution. This is done to ensure a larger surface of the liquid phase6 when a gas stream is added to an absorption column with a relatively high flowrate, the corresponding amount of amine will be relatively low.7 If water is not added, it will be impossible to ensure a good contact between the gas and liquid, which will cause a less-efficient sweetening process. Thus, water is normally added up to 75 mol% when performing gas sweetening.8
The absorption process takes place in a column that contains a certain calculated number of stages. The mass balance used in this analysis was the McCabe-Thiele model. The two inlet streams are the feed gas and the lean amine. The temperature of the amine-water stream should be at least 5°C warmer than the acid gas stream in the absorption column to avoid components of the natural gas condensing into the liquid amine stream. The pressure of the absorption column during operation was around 49 bar, which is normally accepted for the absorption column.9
Results of steady-state simulation and process optimization. To evaluate the efficiency of gas sweetening, several treatment cases were modeled in the proprietary simulation softwarea. In all simulations, H2S content had to be below 4 ppm to match the specifications for clean gas. Nine cases were modeled to investigate the efficiency of tray and packed columns and to evaluate thermodynamic models. The amine treatments used were monoethanolamine (MEA), DEA, diglycolamine (DGA), piperazine (PZ), triethylamine (TEA), diisopropylamine (DIPA) and MDEA. For all cases, the amine packages (for acid gas cleaning) in the modeling were used.10
Chemical absorption by amines. Selecting the appropriate solvent for gas sweetening depends on various conditions that can include the ability to remove H2S and CO2, the pickup rate of hydrocarbons, and the heat requirement for solvent regeneration, as well as vapor pressure, foaming, selectivity, thermal stability, corrosivity, cost and availability.11 In this simulation experiment, amine and amine blends were used as sweetening solvent. The chemical reactions for MEA and DGA included the following (“R” refers to amine):
• RNH2 + H2S = RNH3HS
• RNH2 + H2O + CO2 = RNH3HCO3.
Chemical reactions for DEA are:
• R2NH + H2S = R2NH2HS
• 2R2NH + CO2 = R2NCOOR2NH2.
Chemical reactions for MDEA and DIPA are:
• R2NCH3 + H2S = R2NHCH3HS
• R2NCH3 + CO2 + H2O = R2NHCH3HCO3.
Process optimization. The aim of this optimization work was to study the effects of using various types of amine and amine blends on amine plant performance. Therefore, optimization options were studied by applying various amines at constant concentrations within the simulation to monitor changes in the composition of sour gas streams.
The experiments used 32 wt% of different amine and amine blends in the GUPCO gas sweetening plant by maintaining some operational conditions (e.g, sour gas stream pressure and temperature, and lean amine pressure and temperature). Once the simulation was concluded, the results for H2S and CO2 in the sweet gas streams were recorded.
Parametric sensitivity analysis and simulation modeling using MEA. In TABLE 2, the H2S composition of sweet gas is 4.508e-004 ppm. The recovery for removed H2S from both the sweet gas and the acid gas (H2S and CO2) was 100%. Amine strength was 32 wt% and the amount of regenerated steam required for the regenerator was 307.4 tpd. Moreover, the total flowrate required was 170 bpd, and the total mass flow required from MEA was 366.5774 kg/hr. The composition of sweet gas by mole fraction for methane was 0.806; for ethane, it was 0.1049. The operating condition for the rich amine stream was 48.03 kg/cm2 and the temperature was 39.27°C (102.69°F).
 |
Parametic sensitivity analysis and simulation modeling using DEA. Treatment by DEA is shown in TABLE 3. The H2S composition in the sweet gas was 4 ppm. The recovery for removed H2S was 99.33%, while the recovery of both H2S and CO2 was 97.47%. The amine strength was 32 wt%, and the amount of regenerated steam required for the regenerator was 307.4 tpd.
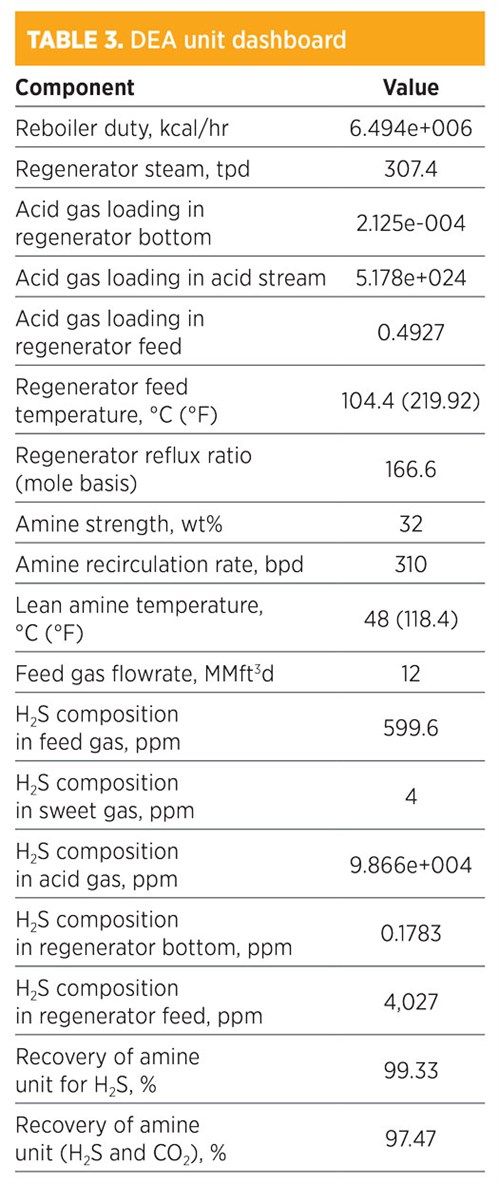 |
After the trial, it was found that the best flowrate of DEA to meet specifications was 310 bpd, and, to meet the concentration of H2S in sales gas specifications, the total mass flowrate required from DEA was 683.806 kg/hr. In addition, the concentration (mole fraction) of methane in the sweet gas stream was 0.8057; for ethane, it was 0.1049. The operating conditions of the rich amine included a pressure of 48.03 kg/cm2 and a temperature of 38.98°C (102.16°F).
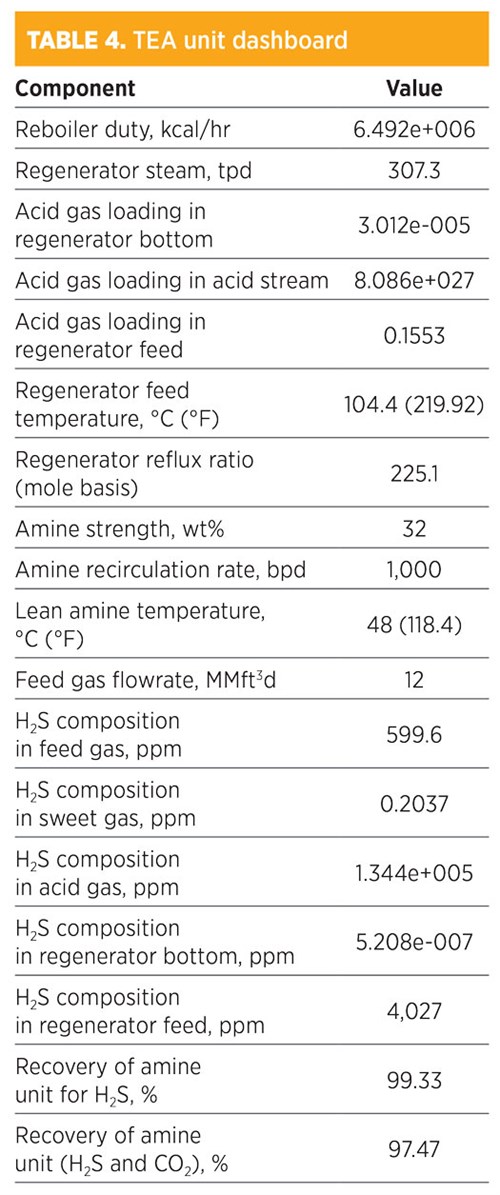
Parametic sensitivity analysis and simulation modeling using TEA. Treatment by TEA is shown in TABLE 4. H2S composition in the sweet gas was 0.2037 ppm. The recovery for removed H2S was 99.97%, while the recovery of both H2S and CO2 was 70.29%. The total mass flowrate of TEA to recover this amount was 2,220 kg/hr. The amine strength was 32 wt%, and the amount of regenerated steam required for the regenerator was 307.3 tpd. In addition, the concentration (mole fraction) of methane in the sweet gas stream was 0.8042; for ethane, it was 0.1047. The operating conditions of the rich amine included a pressure of 48.03 kg/cm2 and a temperature of 39.22°C (102.6°F). The total mass flowrate required to remove acid gas by 70.29% was 1,000 bpd.
 |
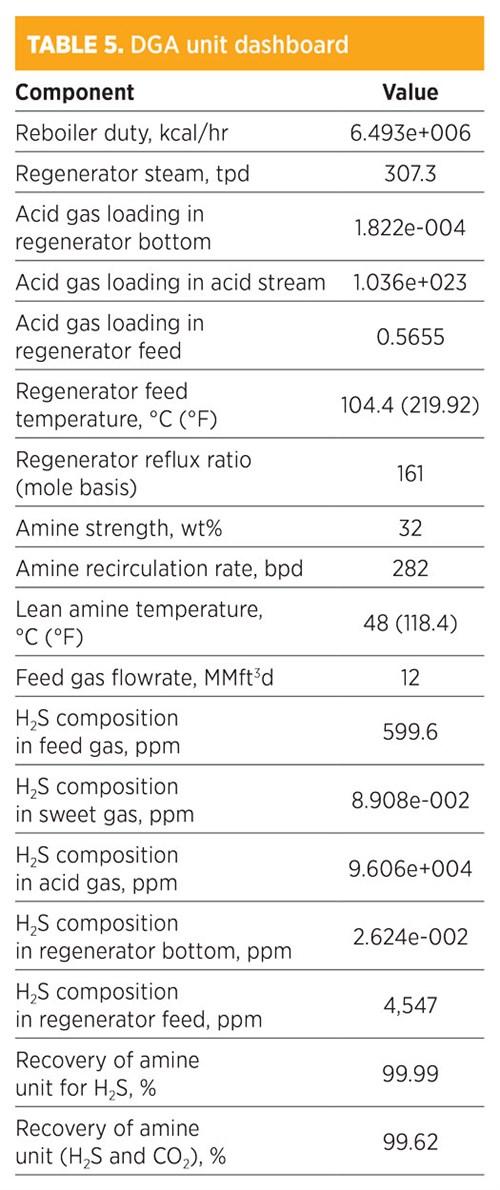
Parametic sensitivity analysis and simulation modeling using DGA. Treatment by DGA is shown in TABLE 5. H2S composition in the sweet gas was 8.908e-002 ppm. The recovery for removed H2S was 99.99%, while the recovery of both H2S and CO2 was 99.62%. The amine strength was 32 wt%, and the amount of regenerated steam required for the regenerator was 307.3 tpd. The total mass flowrate required from DGA was 608.73 kg/hr. The concentration (mole fraction) of methane in the sweet gas stream was 0.8058; for ethane, it was 0.1049. The operating conditions of the rich amine included a pressure of 48.03 kg/cm2 and a temperature of 38.77°C (101.8°F). The total mass flowrate required to remove acid gas by 99.62% was 282 bpd.
 |
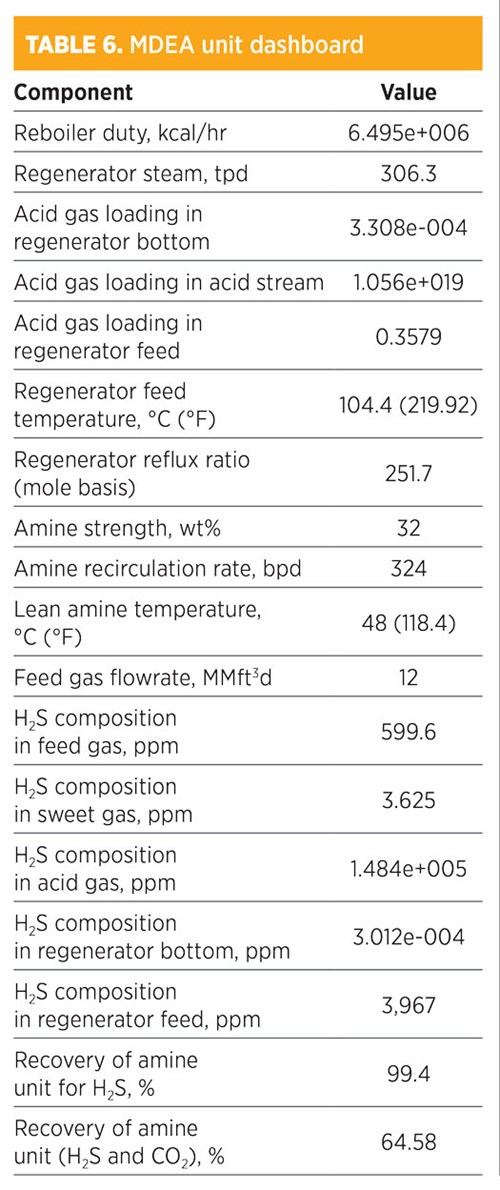
Parametic sensitivity analysis and simulation modeling using MDEA. Treatment by MDEA is shown in TABLE 6. H2S composition in the sweet gas was 3.625 ppm. The recovery for removed H2S was 99.4%, while the recovery of both H2S and CO2 was 64.58%. The amine strength was 32 wt%, and the amount of regenerated steam required for the regenerator was 306.3 tpd. The total mass flowrate required from MDEA was 707.48 kg/hr. The concentration (mole fraction) of methane in the sweet gas stream was 0.8046; for ethane, it was 0.1047. The operating conditions of the rich amine included a pressure of 48.03 kg/cm2 and a temperature of 38.71°C (101.7°F). The total mass flowrate required to remove acid gas by 64.58% was 324 bpd.
 |
Parametic sensitivity analysis and simulation modeling using DIPA. Treatment by DIPA is shown in TABLE 7. H2S composition in the sweet gas was 355.6 ppm. The recovery for removed H2S was 40.7%, while the recovery of both H2S and CO2 was 85.12%. The amine strength was 32 wt%, and the amount of regenerated steam required for the regenerator was 307.6 tpd. The total mass flowrate required from MDEA was 774.95 kg/hr. This data showed that the concentration of H2S and CO2 were with the trays at the top of the absorber. However, H2S concentration increased until Tray 6, and then decreased from Tray 5 and so on.
 |
The concentration (mole fraction) of methane in the sweet gas stream was 0.8051; for ethane, it was 0.1048. The operating conditions of the rich amine included a pressure of 48.03 kg/cm2 and a temperature of 38.73°C (101.7°F). The total mass flowrate required to remove acid gas by 85.12% was 360 bpd.
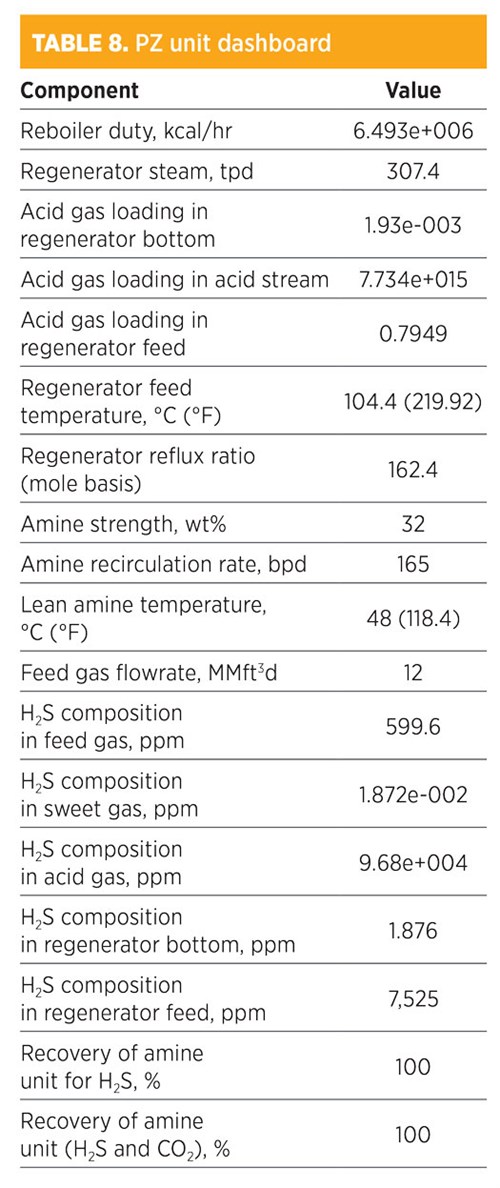
Parametic sensitivity analysis and simulation modeling using PZ treatments. Treatments by PZ activators are shown in TABLE 8. H2S composition in the sweet gas was 1.872e-002 ppm. The recovery for removed H2S was 100%, while the recovery of both H2S and CO2 was also 100%. The amine strength was 32 wt%, and the amount of regenerated steam required for the regenerator was 307.4 tpd. The total mass flowrate required from PZ was 357.3 kg/hr. The concentration (mole fraction) of methane in the sweet gas stream was 0.8059; for ethane, it was 0.1049. The operating conditions of the rich amine included a pressure of 48.03 kg/cm2 and a temperature of 39.03°C (102.3°F). The total mass flowrate required to remove acid gas by 100% was 165 bpd.
 |
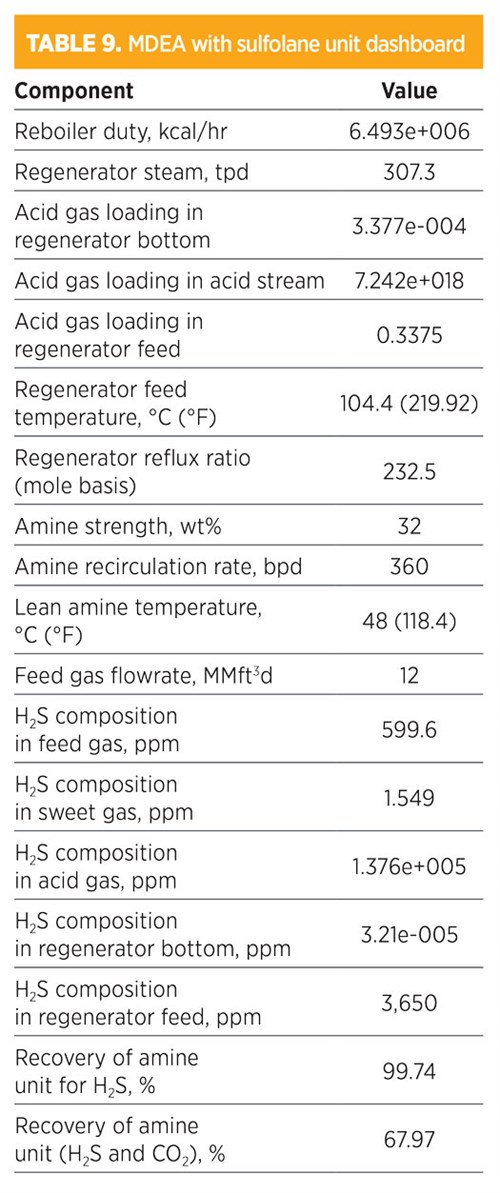
Parametic sensitivity analysis and simulation modeling using MDEA with sulfolane. Treatments using MDEA with sulfolane are shown in TABLE 9. H2S composition in the sweet gas was 1.549 ppm. The recovery for removed H2S was 99.74%, while the recovery of both H2S and CO2 was 67.97%. The amine strength was 32 wt% (32% for MDEA and 2% for sulfolane), and the amount of regenerated steam required for the regenerator was 307.3 tpd. The total mass flowrate required from MDEA was 789.51 kg/hr and 49.3 kg/hr for sulfolane. The concentration (mole fraction) of methane in the sweet gas stream was 0.8047; for ethane, it was 0.1047. The operating conditions of the rich amine included a pressure of 48.03 kg/cm2 and a temperature of 38.81°C (101.9°F). The total mass flowrate required to remove acid gas by 67.97% was 360 bpd.
 |
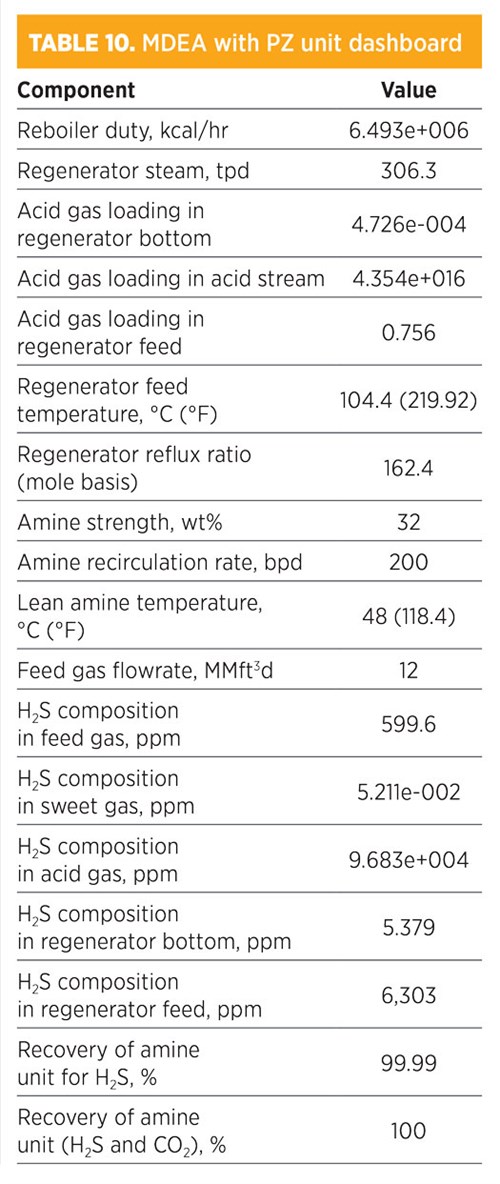
Parametic sensitivity analysis and simulation modeling using MDEA with a PZ mixture. Treatments by the PZ activators with MDEA are shown in TABLE 10. H2S composition in the sweet gas was 5.211-002 ppm. The recovery for removed H2S was 100%, while the recovery of both H2S and CO2 was also 100%. The amine strength was 32 wt% (16% for MDEA and 16% for PZ), and the amount of regenerated steam required for the regenerator was 306.3 tpd. The total mass flowrate required from MDEA with PZ was 435 kg/hr. The concentration (mole fraction) of methane in the sweet gas stream was 0.8058; for ethane, it was 0.1049. The operating conditions of the rich amine included a pressure of 48.03 kg/cm2 and a temperature of 39.25°C (102.7°F). The total mass flowrate required to remove acid gas by 100% was 200 bpd.
 |
Takeaway. This study used proprietary simulation softwarea to test GUPCO’s gas sweetening process design calculations. While the plant receives high amounts of acid gas, this challenge can be solved by changing the type of amine used at the gas sweetening plant. In addition, the simulation study achieved a high rate of acid removal for nearly all amine types and blends, enabling the natural gas to meet pipeline specifications. The optimal solution was 32% MEA with a circulation rate of 170 bpd.
The study also examined several process parameters, including reboiler duty, regenerator steam and acid gas removal. According to the simulation, 32% MEA is the most recommended amine for the process; however, PZ and MDEA at 32 wt% (16% PZ and 16% MDEA) reached full efficiency characteristics. A recirculation rate of 200 bpd was required, though, while the PZ activator needed a recirculation rate of 165 bpd. The cost of PZ chemicals is more expensive than the cost of MEA chemicals, as well. GP
NOTE
a Aspen HYSYS V8.8
LITERATURE CITED
- Miller, L. N., R. A. Macriss and T. S. Zawacki, “Process for acid gas removal from gaseous mixtures,” U.S. Patent US4080424A, March 21, 1978.
- Cornelissen, A. E., “Simulation of absorption of H2S and CO2 into aqueous alkanolamines in tray and packed columns,” Chemical Engineering Research and Design, Vol. 58, No. 4, 1980.
- Cavani, F., G. Centi, S. Perathoner and F. Trifiro, Sustainable Industrial Chemistry, Wiley-VCH Verlag GmbH and Co., Weinheim, Germany, 2009.
- Kohl, A. and R. Nielsen, Gas Purification, 5th Ed., Elsevier, August 1997.
- Laddha, S. S. and P. V. Dancwerts, “The absorption of CO2 by amine-potash solutions,” Chemical Engineering Science, 1982.
- Lieberman, N., Troubleshooting Refinery Processes, PennWell Publishing Co., January 1981.
- Mandal, B. and S. S. Bandyopadhyay, “Simultaneous absorption of CO2 and H2S into aqueous blends of n-methyldiethanolamine and diethanolamine,” Environmental Science Technology, August 2006.
- Maddox, R., Gas and Liquid Sweetening, J. M. Campbell Books, Tulsa, Oklahoma, January 1977.
- Kamps, A. P. S., J. Xia and G. Maurer, “Solubility of CO2 in (H2O + piperazine) and in (H20 + MDEA + piperazine),” AIChE Journal, April 2004.
- Mackenzie, D., C. A. Daniels and J. Bullin, “Design and operation of a selective sweetening plant using MDEA,” Bryan Research and Engineering Inc., 1987, online: https://www.bre.com/PDF/Design-and-Operation-of-a-Selective-Sweetening-Plant-Using-MDEA.pdf
- Liu, H. B., C. F. Zhang and G. W. Xu, “A study on equilibrium solubility for carbon dioxide in methyldiethanolamine-piperazine-water solution,” Industrial and Engineering Chemistry Research, September 1999.
NADY S. ABBAS is the Head of the Process Department at GUPCO in Cairo, Egypt. He has 13 yr of experience in gas production and processing, with an expertise in the conceptual design of chemical processes, along with plant commissioning, startup and troubleshooting. He is also highly experienced in dynamic process simulation and process control. He earned MSc degrees in chemical and petroleum refining engineering, and a PG diploma in chemical engineering, both from Minia University in Minia, Egypt. He also earned a BSc degree in petroleum refining engineering from Suez Canal University in Suez, Egypt.
MOHAMMED Z. A. WAHHAB is a Professor in the Department of Chemical Engineering at Minia University in Minia, Egypt.
EMAN A. ASHOUR is a Professor in the Department of Chemical Engineering at Minia University in Minia, Egypt.
TAHA E. FARRAG is a Professor in the Department of Chemical Engineering at Port Said University in Port Said, Egypt.


Comments