
Investigations of high pressure drop observed in ASU columns
The measured pressure drop of columns in air separation units (ASU) is often reported as being higher than the predicted pressure drop. Particularly for high-pressure (HP) columns, the difference can be up to four times higher, depending on the operating pressure of the column. To investigate the difference, the operation data of recently revamped HP columns were collected; then, vapor and liquid loads as well as their physical properties were generated using a process simulation tool. Thereafter, a proprietary hydraulic rating toola was utilized to predict the dynamic pressure drop caused by the column internals. The use of the differential pressure transmitter and its connecting piping inside the cold box was also scrutinized. It was deduced from calculations that the average temperature of gas in the differential pressure transmitter (PDT) piping located inside the cold box was more than four times higher than the temperature of gas inside the column. The resultant different gas static head at the two locations leads to the deviation between the measured and the predicted pressure drop.
Since the 1980s, structured packings have progressively replaced trays, first beginning with the crude argon (CAR) column and low-pressure (LP) columns. Around 2011, in China, structured packings eventually became a default option for HP columns.
It was determined that the pressure drop of columns in the ASUs was higher than what was predicted by the hydraulic rating toola. The extent of the reported deviations was inconsistent—the typical difference was ~20%, which was initially believed to be within the accurate parameters of pressure drop correlations. When the packings-equipped HP columns began to operate nationwide, the observed deviation jumped. For a 550-kPa HP column, the measured pressure drop was three times higher, and for an HP column operated at 900 kPa, the measured pressure drop was four times higher.
Pressure drop in a column is caused by two factors: dynamic pressure drop and static pressure drop (commonly called gas static head). Dynamic pressure drop is the resistance of column internals, such as packings, to gas flow.1,2 The pressure drop decreases with declining gas throughput, and reaches zero if gas flow stops. For a packed column, the dynamic pressure drop is closely linked to packings capacity—e.g., for a proprietary structured packing seriesb, 5.5 mbar/m and 12 mbar/m correspond to 90% and 100% capacity, respectively. Therefore, the dynamic pressure drop measured from a plant is typically used to monitor packings hydraulic performance. In contrast, the static pressure drop is caused by the pressure exerted by gas weight over a certain height.
The gas density in ASU columns can reach 40 kg/m3, depending on the operating pressure of the columns, and structured packings generate much less dynamic pressure drop than trays. Therefore, the gas static head can contribute a significant portion to the total pressure drop for ASU packed columns. The proprietary hydraulic rating tool only calculates dynamic pressure drop, so the gas static head must be manually added to the dynamic one to obtain the total pressure drop of a column. However, the measured pressure drop in ASU plants matches neither the proprietary hydraulic rating tool’sa predicted dynamic pressure drop nor the total manually calculated pressure drop. Rather, it lies between.
Although the deviation does not cause any practical challenges to column design and operation, a joint investigation between the authors’ companies began in early 2020 with the objective of benefitting the ASU industry.
Data collection and analysis. Among the various columns in an ASU, the HP column is the best option for investigation: the simplest HP column consists of only one feed (e.g., the compressed air feed) and two products (i.e., liquid nitrogen at the top and oxygen-enriched liquid at the bottom). The high pressure drop observed in HP columns will not be masked by the inaccuracy of any pressure drop correlations.
In the last 2 yr, the authors’ companies have successfully revamped HP columns from tray to structured packings, and the details of the first project were published elsewhere.3
The operation data of two identical revamped HP columns in a plant were collected in June 2021. The vapor and liquid loads and their physical properties were generated using a process simulation tool, and then the dynamic pressure drop of packings was calculated using the proprietary hydraulic rating toola. The gas static head inside the HP column was calculated manually using Eq. 1:
∆Pstatic pressure drop in HP = ρg × g × h (1)
where,
ρg is the average gas density in the HP column, g is the gravitational acceleration and h refers to the total vertical distance between the pressure taps.
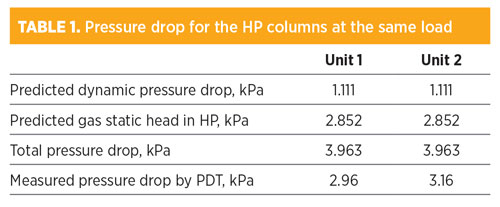
The relevant data are listed in TABLE 1. The measured pressured drop is about three times the dynamic pressure drop predicted by the hydraulic rating tool for both units. It can also be seen that the gas static head contributes to > 70% of the total pressure drop in the column, as the gas density is between 22.7 kg/m3 and 22.4 kg/m3 in the 14-m tall columns.
 |
The HP columns investigated consist of two beds, and FIG. 1 illustrates three different types of pressure drop for the top bed against F-factor, which can be calculated according to Eq. 2:
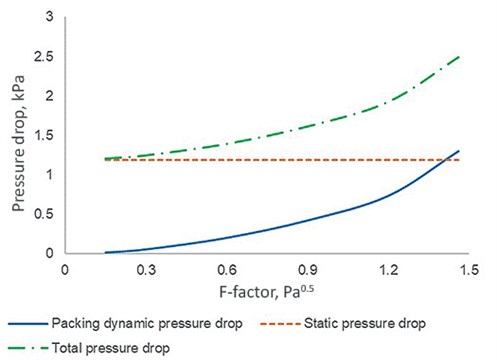 |
| FIG. 1. Pressure drop of the top bed against F-factor. |
F-factor = (V/A) × √ρg (2)
where,
V stands for volumetric flowrate of gas (m3/sec),
A for the tower cross-sectional area (m2) and
ρg for gas density (kg/m3).
The change in gas density is < 1% when the operating pressure of the HP column varies between 545 kPa and 551 kPa (the result of change in throughput). Therefore, it is reasonable to assume that the gas density and the subsequent static pressure drop do not vary with the F-factor, as shown in FIG. 1.
Using two pressure transmitters, the pressure drop in a column can be measured by subtracting the top pressure from the bottom one. The advantage of this arrangement is its simplicity, as the two transmitters (top and bottom) do not need to be connected by a vertical line. However, a disadvantage can be inaccuracy. In this instance, the typical error of 0.1% on the pressure measurement for a column operating at 550 kPa is expected to be +/– 0.55 kPa for both the top and the bottom measurements. Therefore, the pressure drop difference will have an error of +/– 1.1 kPa. A measurement of 3.0 kPa (as shown in TABLE 1) with an error of +/– 1.1 kPa is useless. This method is inadequate, and not recommended in this case.4 A differential pressure method is preferred.
A proprietary transmitter modelc was used in the plant. It is known that, in general, a PDT reading does not indicate the gas static head in a column, as the gas static head in the PDT connecting piping would offset the one in the column. However, in some situations, corrections must be made when the PDT reading has to be rigorously interpreted. For instance, in many applications, inert gas such as nitrogen (N2) is used to purge the piping to prevent condensation of process gas due to lower temperature outside the column. The detailed correction method can be found in literature.1
Since the pressure drop measured by the PDT in the ASU was much higher than the predicted dynamic one, corrections were conducted to verify whether the deviation can be explained. A particularity of cryogenic distillation (as found in an ASU) is that the temperature of the piping connecting to the PDT is higher than the temperature inside columns, thus no inert gas needs to be injected into the piping. Instead, process gas enters the pressure piping directly.
To evaluate the impact of the gas static head on the PDT reading, the space arrangement of PDT piping connected to the HP column in the cold box was retrieved from installation drawings. The piping in Unit 1 is shown in FIG. 2 and simplified in FIG. 3. The representative piping with numerous bends counters thermal expansion and contraction in a range of more than 200°C (392°F) between normal operations and startups/shutdowns. The transmitter is on the lower platform for ease of access (h1 at 10,465 mm and h2 at 2,400 mm). On the day when the operation data were recorded, the ambient temperature was 27°C (81°F). It should be noted that that the detailed pressure piping design may vary among licensors.
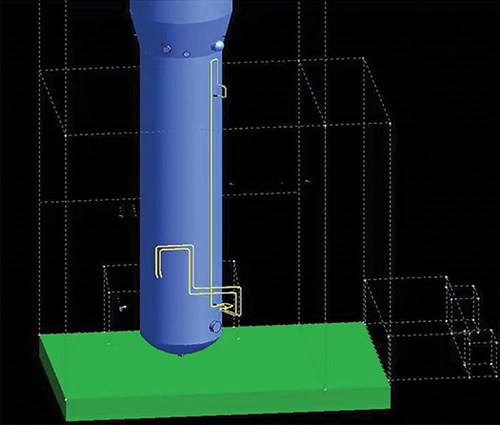 |
| FIG. 2. PDT taps and piping connected to the HP column in the cold box (other equipment is omitted for clarity). Note: the dotted lines indicate the contour of the cold box. |
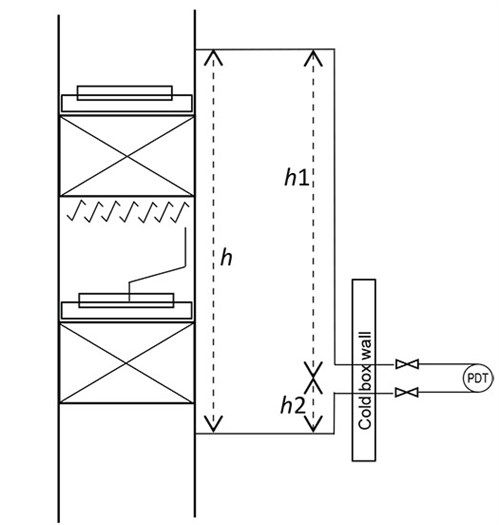 |
| FIG. 3. The simplified HP column and PDT piping. |
Unfortunately, like in many other plants, the PDT piping local temperature was not available despite the fact that the temperature of the cold box foundation is closely monitored. A different approach was taken in corrections: match back the temperature of the piping based on the measured pressure drop.
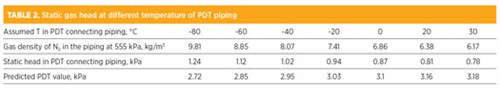
A large temperature gradient between the column and the wall of the cold box was expected, as the temperature inside the HP column was close to –180°C (–292°F), in contrast with the 27°C (81°F) ambient temperature. By varying the temperature, the gas density of a pure N2 at 5.51 bar was calculated and is tabulated in TABLE 2. As shown, the gas density changes with temperature, and its values in the temperature range investigated are at least two times smaller than the gas density in the HP column. Similarly, the density of the O2-enriched gas is also calculated at the corresponding temperature. The static pressure drop in the piping is calculated based on Eq. 3:
 |
∆Pstatic pressure drop in the tubing = ρg1 × g × h1 + ρg2 × g × h2 (3)
where,
ρg1 and ρg2 refer to gas density in the upper and lower piping, respectively. Then, the predicted pressure drop by the PDT is obtained by correcting the dynamic pressure drop (Eq. 4):
PDT = ∆Ppacking dynamic pressure drop + ∆Pstatic pressure drop in HP column – ∆Pstatic pressure drop in the piping (4)
When the piping temperature is assumed as –40°C (–40°F) and 20°C (68°F) for Units 1 and 2, respectively, the calculated PDT values match the site PDT readings at a unit capacity of 20 kNm3/hr.
It is worth mentioning that in the two identical units, the main equipment and their space arrangements are exactly the same, but the space arrangements of instrument piping are not.
FIG. 4 exemplifies the impact of the temperature of PDT piping on different types of pressure drop. It can be seen that the predicted PDT reading rises with increasing temperature in the PDT piping, and the slope is steep at lower temperatures. It is also apparent that the piping for Unit 2 is closer to the wall of the cold box. The calculations at other loads deduced the same temperature for each unit, confirming the plant data acquired are consistent and of quality.
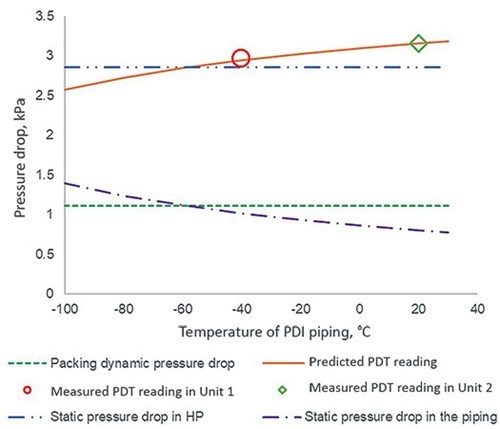 |
| FIG. 4. Pressure drop of the HP column against the temperature of PDT piping at a capacity of 20 kNm3/hr. |
Assuming a uniform piping temperature in the calculations above is correct for qualitative analysis. However, considering the isometric of the pressure piping in the cold box and its variations in different projects, precise quantification of the gas static head in the piping requires temperature gradient along the piping.
In addition to the variation associated with the temperature gradient along the piping, the location of the transmitter outside the cold box—which is also project dependent—affects the gas static head in the piping to a small extent. Specifically, in the case investigated here, the gas in the upper piping is nearly pure N2 with trace of oxygen (O2) and argon (Ar), and the gas in the lower piping consists of 37.8% O2 and 1.6% Ar. As the gas density is a function of its composition, if the location of the transmitter changes, then the gas static head in the piping would also change, according to Eq. 3.
Inferences. Despite being a theoretical exercise, the calculations in this paper are adequate to conclude that the deviation between the predicted dynamic pressure drop and the PDT reading is caused by the difference between the gas density in the HP column and the gas density in the pressure piping due to the great temperature difference. The larger the difference in gas density, the greater the deviation.
This can also explain why only a 10%–30% deviation has been observed with the LP and CAR columns. First, the gas density difference is still the primary reason for the deviation. Due to much lower operating pressure, the gas density in the LP and CAR columns are in the range of 5 kg/m3–8 kg/m3; therefore, the gas static head becomes a smaller portion of the total pressure drop (the curves of static and total pressure drop would shift downwards in FIG. 1 in such a case). Using gaseous N2, FIG. 5 illustrates the impact of column operating pressure on the gas density at different temperatures.
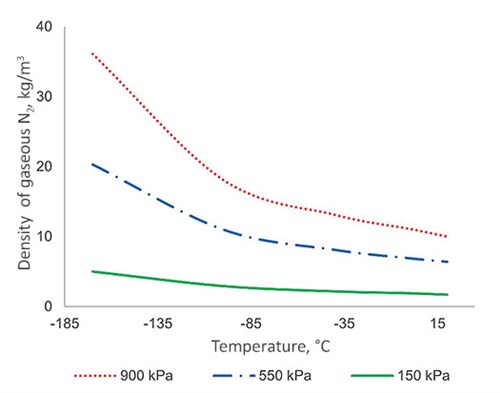 |
| FIG. 5. Density of gaseous N2 at different temperature and pressure. |
Takeaway. Due to the temperature gradient along the piping of the differential pressure transmitter and its varying position in the cold box, it would be challenging—if not impossible—to deduce from a PDT reading either the dynamic pressure drop of packings or the total pressure drop of a column. Hence, unlike in other applications, PDT readings in an ASU cannot be used to judge how far the columns are from flooding, nor can they provide any input to process simulation and upstream equipment sizing, significantly limiting typical uses. To obtain the correct pressure drop for ASU columns, zero calibration5 can be considered based on gas density. However, this requires the gas temperature in the pressure piping.
To investigate the difference between the PDT reading and the predicted pressure drop, the operation data of HP columns in the ASU were collected and processed. It was determined the deviation is caused by significant temperature difference between the HP column and the differential pressure transmitter piping. The PDT reading corresponds neither to the dynamic pressure drop of packings nor the total pressure drop of the column. GP
NOTES
a Sulzer’s Sulcol™
b Sulzer MellapakPlus™ series
c YOKOGAWA EJA110E
LITERATURE CITED
- Cai , T. J. and M. R. Resetarits, “Pressure drop measurements on distillation columns,” Chinese Journal of Chemical Engineering, 2011.
- Kehrer, F., L. Spiegel, E. Kolesnikov and P. Choo, “Experimental investigation and modelling of Sulzer I-ring hydraulics,” Chemical Engineering Research and Design, Vol. 84, Iss. 11, November 2006.
- Yang, Q., J. J. Dong, F. J. Feng and X. D. Zhang, “Revamping an air separation unit,” PTQ, 2019.
- Kister, H. Z., “Distillation operation,” McGraw-Hill Inc., New York, 1990.
- American Institute of Chemical Engineers (AIChE), Tray distillation columns: A guide to performance evaluation, 2nd Ed., Wiley, New York, New York, 1987.
 |
FENGJIE XU is a Senior Engineer at China National Air Separation Engineering Co. Ltd., where he is responsible for R&D of ASU processes and ASU energy-saving technologies.
He has been engaged in the field of air separation for 15 yr, and holds a BE degree in energy and environmental engineering.
 |
FENGHUA ZHOU is a Senior Engineer at China National Air Separation Engineering Co. Ltd. She specializes in the automation design and R&D of control technology for ASUs.
She has more than 19 yr of experience in the field of air separation automatic control and holds an MA degree in control engineering.
 |
ZHIMING CAO is a Senior Project Manager at China National Air Separation Engineering Co. Ltd. with responsibility over equipment integration, construction, erection and project management. His 21 yr of process project management experience ranges from engineering design, equipment installation to commissioning, etc., for ASU projects.
 |
QUAN YANG is a Sulzer Senior Technical Expert, specializing in mass transfer components. He is in charge of air separation knowledge management within Sulzer Chemtech. Recently, his field expanded to process optimization for DWC. Dr. Yang holds a PhD in environmental engineering from the National University of Singapore.
 |
LAURENT ZUBER heads Process Innovation and Technology Management at Sulzer Chemtech Ltd. in Winterthur, Switzerland. He joined Sulzer in 1995 as a Process Engineer
for chemical and petrochemical separation units, and has held different positions in application management. He has a special interest in advanced distillation solutions and difficult product separation. Dr. Zuber holds a PhD in chemical engineering from the Swiss Institute of Technology of Zurich.
 |
JIAO-JIAO DONG is a Principle APT Engineer at Sulzer Chemtech China in Shanghai, China. In her 13 yr with Sulzer, her main responsibilities have included driving ASU business in the China market and advocating the best designs and practices of column internals optimized for ASUs. She holds an MS degree in chemical engineering from the East China University of Science and Technology.


Comments