
Simulation and optimization study for a condensate recovery system
This article discusses a simulation and optimization study for a low-pressure condensate recovery system used on an oil and gas platform for the extraction of valuable hydrocarbons from flare gas for sale. Due to the possibility of hydrates formation, methanol is used as a hydrate inhibitor in this case.
A base case simulation model was constructed, using commercial softwarea to identify high-risk points where methanol injection is to be performed. The use of methanol entails increased operating cost; therefore, it is necessary to determine the relationship between the methanol flowrate and condensate recovery, as well as the operating temperature of the cold separator. The latter has a significant effect on the condensate recovered.
The optimum methanol flowrate was determined by maximizing the profitability of the system through an optimization model, which is a linear program (LP). The LP model was solved using Microsoft Excel Solver. The optimum temperature was determined to be –21.6°C, with a net profit of $18,000/d. The system was determined to have an emissions avoidance of approximately 39,000 tpy of CO2 through the recovered condensate.
The three major sources of natural gas in the oil and gas industries are oil, gas and condensate wells. Natural gas found in oil wells is termed as associated gas and is either dissolved in the oil phase or remains as cap gas above the oil.1,2 The associated gas may have a similar composition to that of natural gas, but the specific composition can vary significantly based on the production location and the properties of the well.
Heavy investment has been reported for the further processing of this gas. However, some of this gas is flared due to technical or economic limitations. It has been reported that more than 17,000 oil production facilities worldwide have flared approximately 140 Bm3/yr of natural gas, resulting in the emissions of more than 350 MMt of CO2 (along with other pollutants).2
The oil and gas industries continue to work diligently toward CO2 abatement. The contribution from large industry players such as ExxonMobil, Shell and BP contributed to a CO2 reduction of about 12% between 2010 and 2015.3 The World Bank has initiated “Zero routine flaring by 2030” and encourages global oil companies to endorse the efforts in mitigating CO2 emissions.4 Different attempts have been reported to reduce flaring, e.g., re-injection into oil reservoirs to maintain pressure and to increase oil recovery,2 zero flaring during startup,5 condensate recovery system,6 etc. In particular, the low-pressure condensate recovery system (LP-CRS) has been reported to extract valuable hydrocarbons from flare gas under low pressure with minimal rotating equipment.
Background. The Tembikai oil and gas field is located 150 km offshore the east coast of Peninsular Malaysia. It includes three production wells and a central processing platform (CPP). The oil from the CPP is sent to a floating storage and offloading (FSO) vessel through a flexible subsea pipeline.7 The associated gas from the Tembikai CPP has been flared in the traditional practice. The flared gas consists predominantly light hydrocarbons [e.g., methane (C1) to butane (C4)] and significant quantities of pentane (C5) and heavier components (C5+).
An LP-CRS has been installed that is specifically tailored for the extraction of valuable C5+ components. The LP-CRS makes use of a turboexpander coupled with a Joule Thomson (JT) valve, allowing the system to perform at a lower temperature to maximize condensate recovery.8 In this work, optimization is performed for the LP-CRS to minimize the amount of methanol required for the prevention of hydrates formation in the pipelines.
The associated gas is produced from a reservoir where it stays in equilibrium with water—the low operating temperature may lead to the formation of hydrates, which are formed through the crystallization process where the gas molecules are trapped in crystalline cells formed from the hydrogen bonds of water molecules. A high-pressure and low-temperature environment assists the formation of hydrates.9 Hydrates reduce the diameter and ultimately block the pipeline, downhole tubing, tree and manifold piping, flowlines and risers. The plugs can be difficult to locate and remove, leading to significant losses in production and revenues.
Dehydration can be used to eliminate the formation of a condensed water phase.10 However, in certain cases, dehydration may be impractical or economically feasible. Therefore, inhibition is commonly used to prevent the formation of hydrates. Thermodynamic inhibitors—typically methanol or glycol injection—lower the hydrate formation temperature at a given pressure. For cases of below ambient temperature, methanol injection is preferable to avoid the viscosity and freezing issues of glycol. However, the methanol content should be kept at its minimum level, as it incurs additional operating cost to the system. It also impacts downstream processes and presents environmental limitations on overboard discharge.11
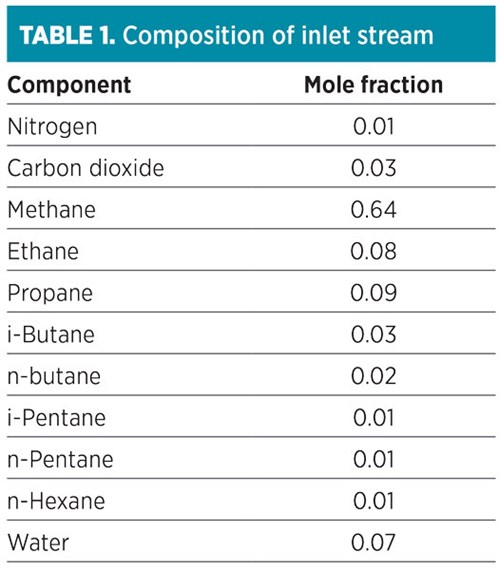
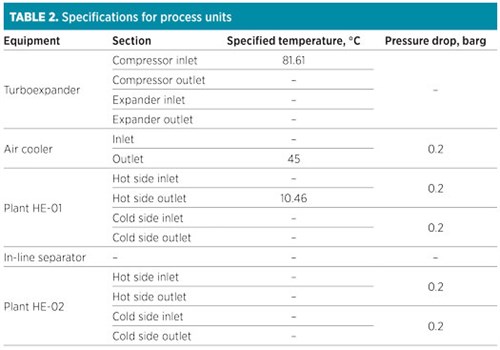
Base case process simulation. FIG. 1 shows the base case simulation model of a condensate recovery system simulated using commercial softwarea using Peng-Robinson as its thermodynamic model. Peng-Robinson presented the worst-case scenario, while other models displayed ice formation only under similar process conditions at the respective high-risk points. The inlet stream consisted of associated gas with a volume of 8.0 MMft3d, with a temperature and pressure of 81.6°C and 6 bar, respectively. The composition of the gas stream is given in TABLE 1, while the specifications of the units are given in TABLE 2.
 |
| FIG. 1. Simulation flowsheet of condensate recovery system. |
 |
 |
The associated gas entered the compressor side of the turboexpander and left at 9 barg. The compressed gas then entered an air cooler, where it was cooled to 45°C. The outlet stream was then fed to the hot side of Plate Heat Exchanger 1 (HE-01), where it was cooled further to 10.5°C before passing through an inline separator. The latter removed 98% of the water present in the feed at its bottom stream (Sep. Bottom), along with some low-quantity heavy end hydrocarbons (C4s and C5+). This stream was discharged from the system.
Next, the top product from the separator was passed through the hot side of plate HE-02, where it was cooled to –21.6°C. This chilled stream was then sent to the cold separator, where the heavy end hydrocarbons were recovered as the main product of the system at its bottom stream. The top product of the cold separator was passed into the expansion section of the turboexpander, where its pressure was reduced to 1.7 barg.
The energy recovered from the expander was supplied to the compressor section of the turboexpander for the compression of feed. The compressed stream was then passed on to Plate HE-02 to cool the hot streams. This stream was then combined with the bottom stream of the suction scrubber (Scrub. Bottom), which consists mainly of water. Finally, this stream was used to cool the hot streams in Plate HE-01 before it was sent to flare.
Methanol injection. Before determining the methanol intake, the high-risk points in the system were first identified. These are locations where hydrate formations were likely to occur. First, the outlet stream of Plant HE-02 (i.e., HE02-Out1 stream) was found to exhibit Type II hydrate formation, according to stream analysis results of the simulation model. Note: Type II hydrates will form in the case of gas mixture,10 and they are relatively more stable and form at a higher temperature compared to Type I. Since stream HE02-Out1 is the inlet stream to the cold separator, it was assumed to have the same condition as the separator outlet streams (i.e., the Sep. Top and Product stream).
Therefore, methanol injected at the upstream of HE02-Out1 is sufficient to suppress hydrates formation at the separator inlet and outlet streams. Another high-risk point was found at the expander outlet stream (i.e., Exp. Out) that also exhibits Type II hydrate formation.
The next step was determining the location for methanol injection points. The first high-risk point (i.e., HE02-Out1) is the outlet stream of Plate HE-02. Instead, the inlet stream of the latter (i.e., Sep. Out) was chosen as the first injection point. Even though the temperature of the Sep. Out stream was not low enough to form hydrates, hydrates will form as soon as the temperature is lowered to –21.6°C in Plate HE-02.
Apart from preventing hydrates formation in the HE01-Out1 stream, the tubes within Plate HE-02 are also being protected. Conversely, as the stream temperature continues to drop from –21.6°C (Sep. Top) to –57.0°C (Exp. Out, due to the expansion), the Exp. Out stream was suggested as the second methanol injection point. A concern was that the first methanol inject point located upstream (Sep. Out stream) may not be sufficient to suppress the formation of hydrates at this stream, due to its lower temperature. It is important to ensure good operating condition of Plate HE-02, as it will affect its outlet stream (i.e., HE02-Out2 stream). This then affects the cooling of the HE01-Out stream, and subsequently the Sep. Out stream, in turn impacting the recovery of hydrocarbons in the main product stream.
The base case simulation model was then used to determine the required amount of methanol for both injection points. Analysis showed that 0.35 tpd of methanol is required for the Sep. Out stream (Injection Point 1) and 0.39 tpd for the Exp. Out stream (Injection Point 2). These flowrates should be optimized by considering economic performance.
Prior to the construction of the optimization model, important parameters that affect the systems should be determined. The simulation model revealed that the operating temperature of the cold separator had a significant effect on the methanol requirement and the condensate recovered, while the operating pressure effect was not significant. Therefore, the effect of operating temperature was examined though the simulation model, shown in FIGS. 2 and 3.
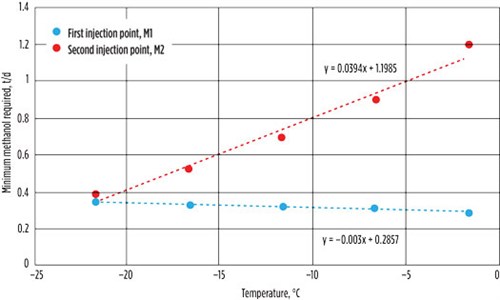 |
| FIG. 2. Graph of methanol flowrate against temperature. |
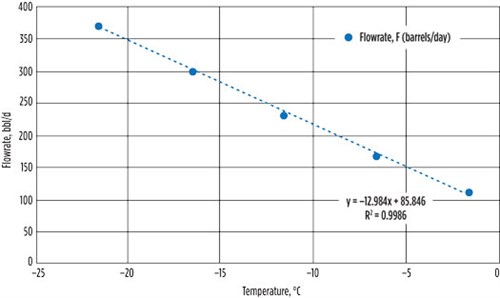 |
| FIG. 3. Condensate recovered at the cold separator against temperature. |
FIG. 2 shows the relationship of the methanol flowrate vs. the operating temperature for the temperature range of –21.6°C to –1.6°C (with temperature intervals of 5°C). The amount of methanol required at the first injection point decreased by only 0.07 tpd when the temperature increases to –1.6°C. However, the methanol required at the second injection increased drastically from 0.39 tpd to 1.19 tpd for the same temperature rise. When the temperature increases, less water is condensed to the bottom of the cold separator (product stream); instead, more water is vaporized to the Sep. Top stream and enters the expander side of the turboexpander. More water content is found in the Exp. Out stream, which increases the tendency of hydrates formation in this stream, leading to an increased requirement of methanol in this stream.
In FIG. 3, the amount of condensate recovered against the temperature of the cold separator is determined. The HE02-Out1 stream is comprised of approximately 40% of hydrocarbons heavier than C2. Therefore, the operating temperature of the cold separator greatly affects the amount of its recovered condensate in the main product stream. It was observed that a higher amount of condensate was recovered at a lower operating temperature of the cold separator. The amount of condensate recovered was observed to drop by 80 bpd for every 5°C decrease in temperature (FIG. 3).
Optimization model. The values obtained from the simulation model were incorporated into a linear regression (FIGS. 2 and 3), and their equations were used as optimization constraints. Eq. 1 shows the methanol required against temperature (first injection point):
FM1 = –0.003T + 0.2857 (1)
Eq. 2 shows the methanol required against temperature (second injection point):
FM2 = 0.0394T + 1.1985 (2)
Eq. 3 shows the condensate recovered against temperature:
FCond = –12.984T + 85.846 (3)
where FM1 (tpd) and FM2 (tpd) represent the methanol flowrate at injection Points 1 and 2 with respect to temperature; FCond (bpd) is the condensate recovered with respect to T (temperature in °C), which represents the operating temperature of the cold separator.
The optimization objective is given by Eq. 4, which is essentially the difference between condensate sales and the methanol cost:
maximize P = (FCond × CCond) – ((FM1 + FM2) × CM) (4)
where P ($/d) represents the profit generated per day; CM ($/t) and CCond ($/t) represent the unit cost of methanol and unit price of condensate, respectively. CM was taken as $295/t and CCond was given the value of $50/bbl.12,13 Note that the above model is a linear program (LP), which may be solved easily with any commercial solver, including Excel.
The objective in Eq. 4 was solved, subjected to the constraints in Eqs. 1, 2 and 3, yielding the maximum profit of $18,136/d (see snapshot in FIG. 4). The model determined that the profit corresponded to 366.8 bpd of condensate recovery (FIG. 4). Verification with the simulation model determines that the condensate recovery is actually 367.8 bpd. Note that for this case, the amount of condensate recovered is the dominant factor of the profit, since the price of condensate is much higher than that of methanol—in terms of flowrate, the flowrate of condensate is again higher than that of methanol. Therefore, the profit obtained is solely dependent on the condensate flowrate.
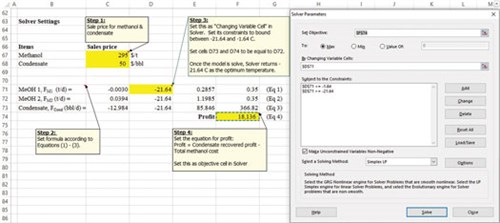 |
| FIG. 4. Excel Solver for solving the LP model. |
However, even if the condensate flowrate is ignored, FIG. 2 shows that a lower cold separator inlet temperature lowers the amount of methanol required. This scenario is justifiable with the increased amount of water and hydrocarbons (C3, C4) being condensed from the cold separator as the temperature decreases. Therefore, the amount of methanol required in the Exp. Out stream drops significantly as the temperature of the HE02-Out1 stream decreases.
Based on the results from the optimizaion model, it was concluded that the optimum operating temperature for the cold separator should be –21.6°C because this temperature recovers the highest amount of condensate with the minimum amount of methanol consumed. It is also worth noting that the condensate recovered by the LP-CRS corresponded to a significant reduction of 39,000 tpy of CO2. This was determined by performing a complete combustion of the recovered condensate (367.8 bpd) using a conversion reactor model in the commercial softwarea (assuming 365 d/yr).
Takeaway. The study provided an optimization study for a condensate recovery process with an LP-CRS. High risk points and their respective methanol flowrates required for inhibition were determined. The report also provided the study of methanol flowrate and condensate recovered as the function of temperature. The mathematical model allows the user to maximize profits gained from condensate recovery, while minimizing the methanol flowrate. The optimized temperature of –21.6°C was obtained with the aid of Excel Solver. The maximum profit gained was calculated as $18,136/d, and it was determined that at least 39,000 tpy of CO2 can be prevented through this system. GP
NOTES
a AspenTech’s HYSYS V10
LITERATURE CITED
- 2B1stconsulting, “Associated gas,” 2012, online: https://2b1stconsulting.com/associated-gas/
- Vorobev, A. and E. Shchesnyak, “Associated petroleum gas flaring: The problem and possible solution,” Springer Proceedings in Earth and Environmental Sciences, pp. 227–230, 2019.
- Smith, B., “How oil companies are helping to reduce emissions,” AZOCleantech, 2018, online: www.azocleantech.com
- World Bank, “Zero routine flaring by 2030,” 2015, online: www.worldbank.org/en/programs/zero-routine-flaring-by-2030
- Hajilary, N., M. Rezakazemi and A. Shahi, “CO2 emission reduction by zero flaring startup in gas refinery,” Materials Science for Energy Technologies, Vol. 20, 2020.
- Mohd Ismail, E., B. Rajah, A. Suppiah and S. Mat Ghani, “Low pressure–Condensate recovery system LP-CRS. Creating value through waste,” SPE Russian Petroleum Technology Conference, Moscow, Russia, 2018.
- Offshore Technology, “Tembikai non-associated gas development,” 2020, online: www.offshore-technology.com/projects/tembikai-non-associated-gas-development
- NGL Tech, “Enhanced recovery systems,” 2017, online: https://www.ngltech.com/lp-crs
- Bai, Y. and Q. Bai, “Hydrates,” Subsea Engineering Handbook, Gulf Professional Publishing, Elsevier, 2010.
- Gas Processors Suppliers Association, Engineering data book, 14th Ed., Tulsa, Oklahoma, 2016.
- Bai, Y. and Q. Bai, “Hydrates,” Subsea Engineering Handbook, Gulf Professional Publishing, Elsevier, 2019.
- Methanex Corp., “Pricing,” 2019, online: https://www.methanex.com/our-business/pricing
- OilMonster, “East Texas condensate crude oil Price today,” 2019, online: www.oilmonster.com/crude-oil-prices/east-texas-condensate-price/29/27
 |
ZHEN KANG LIEW is a chemical engineering graduate of the University of Nottingham, Malaysia (Department of Chemical and Environmental Engineering). His research interests include process synthesis, design, optimization, and oil and gas processing. He completed his research internship, which involved the integration of electrical-conductive waste powder into the nylon pellets for 3D printing filament synthesis, at Kun Shan University, Taiwan in 2019. He also had experience developing mathematical models for horizontal jet release scenario during his summer internship at SynergenOG Sdn. Bhd. in 2018. His final year project covered the extraction and characterization of gelatin from tilapia fish scales. The author can be reached at samliew1996@hotmail.com.
 |
DOMINIC C. Y. FOO is a Professor of Process Design and Integration at the University of Nottingham, Malaysia (Department of Chemical and Environmental Engineering and Center of Excellence for Green Technologies). He is a Professional Engineer (Board of Engineers, Malaysia) and a Chartered Engineer (Engineering Council UK), a Fellow of the Academy of Science Malaysia (ASM), the Institution of Engineers Malaysia (IEM), and Institution of Chemical Engineers (IChemE), as well as the President for the Asia Pacific Confederation of Chemical Engineering (APCChE). Prof. Foo is also the winner of the Innovator of the Year Award 2009 of IChemE, Young Engineer Award 2010 of the IEM, Outstanding Young Malaysian Award 2012, Outstanding Asian Researcher of the Society of Chemical Engineers, Japan (SCEJ) and Top Research Scientist Malaysia 2016. He has more than 160 published papers in chemical, energy and environmental engineering journals, a Chief Editor and Subject Editor for several international journals, and an author and editor for eight books. The author can be reached at dominic.foo@nottingham.edu.my.
 |
MIKE BOON LEE OOI is a Lead Process Engineer at NGLTech Sdn Bhd in Kuala Lumpur, Malaysia. He has 15 yr of working experience in the oil and gas engineering design firm. His works include the development of new technology of condensate recovery systems, low-pressure production units, separator design, and slug suppression systems. The author can be reached at boonlee77@gmail.com.


Comments