
Free water prediction for corrosion protection of NGL pipelines
Natural gas liquids (NGL) separated from natural gas carry varying concentrations of water in the form of free water, water emulsion and soluble water. Typically, free water will form once the total water concentration of NGL rises above its solubility level, and it can be separated out more efficiently by separators or coalescers. The solubility of water in the NGL is dependent on the fluid temperature and on the composition of the condensate; as a consequence, it typically ranges between 50 ppmw and 650 ppmw. Moist NGL becomes cool, and the dissolved water in it can freeze and eventually block the pipeline. Free water can also combine with corrosive gases like H2S and CO2 to form acids, which will often lead to corrosion issues, shortened pipeline life and significant fouling of condensate handling and downstream facilities.
Practical measurement of the solubility of water in NGL at varying process temperatures is difficult due to the highly volatile nature of the liquid and the labor-intensive nature of the process. However, this information is vital for the design and troubleshooting of gas processing facilities, for the control of free water formation in pipelines, and for corrosion protection at gas processing plants.
The study presented in this article shows how the solubility of water in NGL at varying process temperatures can be calculated based on the NGL composition and the water saturation values of the pure components present within it. The obtained moisture results were validated with the standard Karl Fisher moisture content determination method. The developed solubility curve can guide plant engineers in understanding the importance of improving the condensate dehydration step and the selection of appropriate technology or technologies upfront, so that they can remove free water early in the process.
Introduction. NGL, also known as hydrocarbon condensate, are light hydrocarbons in the same family of molecules as natural gas and crude oil that have condensed from the gaseous state of natural gas into a liquid state. This condensation may occur naturally in the wellsite when pressure is reduced, or at the surface. Aboveground, the presence of NGL in natural gas (also called rich gas) is unstable, as heavier components will condense, while lighter components normally remain gaseous and will need to be separated in a gas processing plant, either by distillation or a refrigeration/cryogenic process.
In general, NGL is composed of hydrocarbons, such as propane, butane, pentane, hexane, etc., and compounds with more carbon atoms (such as pentane, or blends of butane, pentane and other hydrocarbons with additional carbon atoms) will exist as liquids at ambient temperatures.1 Hydrocarbon condensate that does not require specific processing can be directly sent to the export pipeline; this is typically the case at offshore production platforms.
Destabilized NGL contain several impurities, such as free, emulsified and dissolved water; salts; acidic components; corrosion inhibitors; hydrate inhibitors (monoethylene glycol, methanol and kinetic hydrate inhibitors); solid particles (e.g., corrosion products, sand); and solid-like particles (e.g., waxes, gels).2–5
Various separation technologies are available to separate gas, impurities, water and salt content from un-stabilized condensate, such as gravity settlers, knockout vessels with mesh pads, electrostatic desalters and cartridge coalescers, cooling (refrigeration), oil absorption, adsorption (such as by activated carbon or silica gel) or membrane processes.6–8 All technologies have specific features that make them suitable for a given set of operating conditions.
Also, integrated NGL recovery can employ different schemes, such as condensation by refrigerant or expander technology.9 Usually, the raw natural gas feedstock from a gas well or a group of wells (oil wells, gas wells and condensate wells) or a gas oil separation plant (GOSP) is cooled to lower the gas temperature to below its hydrocarbon dewpoint at the feedstock pressure. This condenses a large part of the gas condensate hydrocarbons. The feedstock mixture of gas, liquid condensate, and water is then routed to a high-pressure separator vessel (three-phase separator) and coalescers, where the free water and the raw natural gas are separated and removed. The condensate is then treated by a stabilization process (condensate stripper column) prior to export.
A typical NGL process flow diagram is shown in FIG. 1. The stripper column enables the separation of the H2S, moisture and light ends to stabilize and sweeten the NGL product. The condensate stripper reboilers provide the heat required to strip the H2S, residual water and light ends out of the hydrocarbon condensate. This operation aims to reduce the vapor pressure of NGL by eliminating the light fractions to make it safe for storage at atmospheric conditions and for transportation.5–8 The stabilized NGL is marketed under various forms, depending on the production rate, composition and available downstream markets and transportation network.
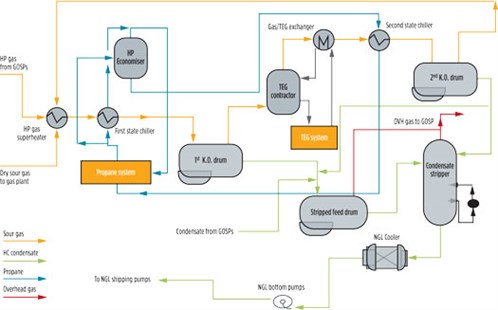 |
| FIG. 1. Typical NGL process flow diagram in central processing facility. |
Water as a contaminant in hydrocarbon condensate has been classified into different categories—usually free, emulsified, dissolved and total water. Free water is not dissolved in NGL. In some cases, it is characterized as the bulk fraction of water that separates out more easily by separators or by using coalescers. Emulsified water is contained in small drops (typically 0.1 micron–50 microns) and is usually more difficult to separate. Soluble water is dissolved at the molecular level in the hydrocarbon phase.
Total water content in condensate downstream of the inlet separators is typically present in concentrations varying from a few hundred ppmw up to 5%. The salinity of the water contamination is determined by the formation of the water, and also varies significantly from a few hundred ppm up to a few hundred thousand ppm.12 Quality specifications of the dehydrated condensate prior to the stabilizer are project-dependent and typically show free water concentrations ranging from 0 ppmv to < 100 ppmv.
Usually, free water is removed from the condensate by using coalescer technology, or by cooling and passing it through a high-pressure separator. Complete free water removal from condensate is often difficult due to the formation of stable condensate/water emulsions, caused by the presence of surfactants, such as hydrate inhibitors and corrosion inhibitors that lower the interfacial tension.3 Also, the condensate contains water in the soluble form. The solubility of water in the condensate is dependent on the fluid temperature and on the composition of the condensate; as a consequence, it can range between 50 ppmw and 650 ppmw, typically.
When moist NGL becomes cool, it can freeze and block NGL lines or pipes. Moreover, the presence of dissolved water in NGL beyond its solubility level is not advisable for transport on pipelines, because any change in ambient temperature or line pressure can lead to the development of free water from dissolved water. The free water can easily combine with acid gases, which can lead to corrosion issues in the condensate storage tank and in the export pipeline. Corrosion of the export pipeline may also represent a major integrity issue that could lead to premature replacement of some sections of the pipeline, if left unattended. An accurate prediction of free water formation is essential to prevent such problems.
The solubility of water in hydrocarbons, even at ambient temperatures, can have great practical importance.14 Based on empirical and theoretical considerations, formulations are available in the literature for the prediction of water solubility in hydrocarbons and its dependence on temperature.14–21 The experimental method is the more accurate way of determining water content at varying process temperatures. In this study, solubility of water in NGL at varying process temperatures was measured by using the NGL composition and the saturation vapor pressure of the pure components present within it. The obtained values were confirmed with Karl Fischer titration. The resulting solubility curve can be used for predicting free water formation at NGL handling facilities.
Outline of experimental procedure. The NGL used in this study were taken from the export pipelines of five different gas handling and processing facilities in Saudi Arabia.
NGL composition. NGL composition was measured using a gas chromatograph equipped with a thermal conductivity detector (TCD), as well as an open tabular column of 100 m × 0.25 mm inside diameter, fused silica-coated with 0.5-micron-bonded methyl silicon. A helium carrier gas linear flow was established at 30 ml/min. Injector and TCD detector temperatures were maintained at 220°C and 250°C, respectively. The column oven temperature was programmed for an initial temperature of 70°C held for 4 min, a ramp-up to 8°C/min, and a final temperature of 200°C for 16 min. The injection volume was 1 µL.
Total water content. The water content of samples from each location was subjected to Karl Fischer coulometric titration (KFT) by following ASTM E1064-16.13 With this method, dissolved and free water can be measured together. The condensate sample was collected in a dry, high-pressure, coated stainless-steel bomb. In the laboratory, the initial weight of the sample was recorded, and the condensate sample was scrubbed through dry ethylene glycol (25 ml in a separatory funnel).
At first, the high-pressure gas associated with the condensate was allowed to bleed slowly through the solvent. When the pressure had dropped considerably, the bomb was inverted and the remaining liquid condensate percolated through the glycol. When the bomb was empty, a gas line was attached to the upstream valve, and dry argon gas was purged through the bomb while heating the bomb walls with an electrical hot air gun. This procedure ensured that residual moisture on the internal walls of the bomb was transferred to the glycol solution (FIG. 2). Two distinct solvent layers should form: a lower glycol layer and an upper condensable hydrocarbon layer. The glycol layer is run off for Karl Fischer (KF) coulometric analysis.
 |
| FIG. 2. Setup for NGL sample preparation for KFT. |
Determination of water saturation constant. To confirm the calculated water saturation constant (Cs), the result was checked with KF results. For this purpose, a sample from GPP-3 was used to prepare a water-saturated hydrocarbon sample (excess water observable) mixed continuously at 300 rpm with magnetic stirrer. Then, the sample and stirrer were placed in a chamber at a set temperature and given enough time to reach equilibrium (18 hr). A coulometric KF titration cell was prepared and set for conditioning. The accuracy of KFT was verified by checking the solution injections. The mass of 1 ml volume at set temperature (23°C) was measured and transferred to the KF chamber. TABLE 5 shows the measured saturated moisture concentration by KFT.
 |
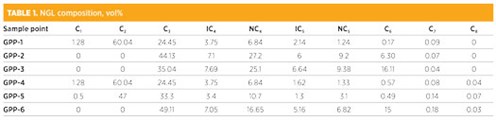
Results. Samples from six gas handing facilities were subjected to gas chromatography analysis. The composition (in vol%) are given in TABLE 1. Énglin et al.21 have tabulated water solubilities in wt% for a number of hydrocarbons at 10°C intervals between 0°C and 50°C. For this study, we selected only water saturation values of pure components (i.e., methane, ethane, propane, i-butane, n-butane, i-pentane, n-pentane, etc.), that are present in NGL at various temperatures (TABLE 2). To calculate the solubility of water in NGL, the water saturation values of pure components are multiplied with the weight fraction of the components in NGL.
 |
 |
NGL water saturation value calculation. For a mixture of organic liquids like NGL, an average saturation value is calculated from the weight fractions and saturation values of the pure components by using Eq. 1:
Average Cs = ∑ni = 0Xi(Cs)i (1)
where:
Xi = Weight fraction of the ith component
(Cs)i = The saturation concentration (ppmw) of the ith component
n = The total number of components.
TABLE 3 illustrates the steps followed to calculate average saturation values for each component of NGL sampled from the sample point GPP-1. TABLE 4 summarizes the water saturation value of NGL sampled from various locations.
 |
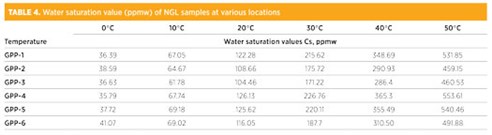 |
Water in NGL may exist under different forms, such as dissolved, emulsified or free water state. Once the water content increases above its solubility limit, then emulsified or free water will appear in the NGL. FIG. 3 shows the water solubility curve of NGL sampled from the facility GPP-1, containing 1.28% of CH4 plus 60.04% of C2H6 plus 24.45% of C3H8 plus 3.75% of i-C4H10 plus 6.84% of n-C4H10 plus 2.14% of C5H12 plus 1.24% of C5H12 plus 0.17% of n-C6H14 plus 0.09% of n-C7H16 with temperature ranges from 0°C to 50°C. In the region below the curve (Cs line), the soluble water alone can exist; above the line, both free water and soluble water can co-exist.
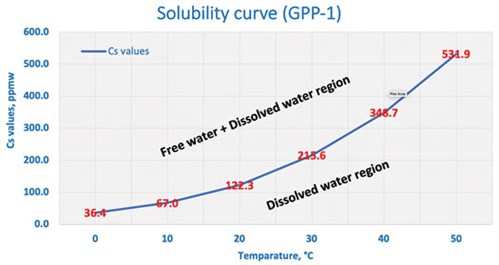 |
| FIG. 3. Water solubility curve of GPP-1. |
As shown in FIG. 3, once the water content of the sample increases above its solubility limit, the free water will appear along with NGL. FIG. 3 shows that the solubility of water in NGL at 30°C is 215.6 ppmw. If the total water content rises above this value (at 30°C), then free water formation will occur.
For example, if the sample contains a total water content of 250 ppm at 30°C, then 34.4 ppmw of water will be in the form of free water and 215.6 ppmw will be in the soluble form. As shown in FIG. 3, once the temperature rises, the solubility of the water NGL will also increase, and vice versa. The solubility limit of water in NGL depends on the temperature—i.e., the higher the temperature, the higher the solubility of water in NGL. FIG. 4 represents the solubility curve of samples from other sample points.
 |
| FIG. 4. Water solubility curves of samples from GPP-2, GPP-3, GPP-4 and GPP-5. |
Sample from downstream of inlet separators. The condensate from downstream of the inlet separators will contain a high water content, including free and soluble water. One sample point was selected for this study at different periods of time, and the results are summarized in TABLE 6. To calculate the Cs values, the composition was obtained from gas chromatography analysis. As shown in the table, total water concentrations were varied from a few hundred ppmw up to 0.3%. For illustration, the recorded temperature of Sample 1 is 47°C; at this temperature, the total water content measured by KFT is 3,000 ppmw. The solubility curve shows that the soluble water content of this sample will be 405.5 ppmw, and the free water content will be 2,594.5 ppm.
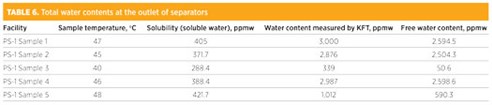 |
FIG. 5 shows the solubility curve of the sample from PS-1. In this sample point, it is recommended to design a facility to remove the free water by additional cooling upfront so that it can remove any free water early on.
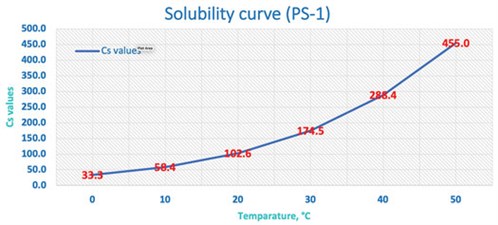 |
| FIG. 5. Solubility of water in NGL vs. temperature |
Recommendations. This study concluded that the solubility of water in NGL at varying process temperatures can be easily calculated, based on the NGL composition and the water saturation values of the pure components present.
The solubility curve can guide engineers in understanding the importance of improving the existing condensate dehydration step and the selection of the appropriate technology or technologies for processing NGL. From the solubility curve, it can be seen that if the plant engineer can maintain a total water concentration of 10 ppmw or below in processed NGL, then free water formation at the pipeline will not occur even if the ambient temperature of the pipeline goes to 0°C. GP
ACKNOWLEDGMENTS
The author would like to express his sincere thanks to SAOO TSD management for their generous support and encouragement during this work.
LITERATURE CITED
- Karimkhani, B. and Z. Khorrami, “Evaluating effect of different operational parameters in increasing performance of condensate stabilizing process in gas plants (case study),” Society of Petroleum Engineers, Presented at the 2009 Kuwait International Petroleum Conference and Exhibition, December 2009.
- Campbell, J. M., Gas Conditioning and Processing, Vol. 2, 8th Ed., February 2004.
- Hughes, V. B., “Aviation fuel handling: New mechanism insight into the effect of surfactants on water coalescer performance,” Second International Filtration Conference, San Antonio, April 1997.
- Hampton, P., T. Darde, R. James and T. H. Wines, “Liquid-liquid separation technologies improves IFPEXOL process economics,” Oil & Gas Journal, Vol. 99, No. 16, April 16, 2001.
- Wines, T. H. and R. L. Brown, Jr., “Minimizing liquid contaminants in natural gas liquids,” presented at Gas Processors Association 75th Annual Meeting, March 1996.
- Kidnay, A. J., W. R. Parrish and D. G. McCartney, Fundamentals of Natural Gas Processing, 2nd Ed. CRC Press, Taylor and Francis Group, 2011.
- Rojey, A., C. Jaffret, S. Cornot-Gandolphe, B. Durand, S. Julian and M. Valais, Natural Gas: Production, Processing, Transport, Editions Technip, Paris, 1997.
- Speight, J. G., Natural Gas: A Basic Handbook, Gulf Publishing Co., Houston, Texas, 2007.
- Attaway, D. A., S. Huang, H. Kotzot and C. A. Durr, “Optimal process location for NGL recovery in LNG plant,” AIChE Spring National Meeting, Conference Proceedings, 2005.
- Mokhatab, S., W. Poe and J. Speight, Handbook of Natural Gas Transmission and Processing, 1st Ed., September 2006.
- Campbell, J. M., Gas Conditioning and Processing, Vol. 1, 8th Ed., February 2004.
- Buck, A. L., “New equations for computing vapor pressure and enhancement factor,” J. Appl. Meteorol., Vol. 20, 1981.
- ASTM International, ASTM E1064-16, “Standard test method for water in organic liquids by coulometric Karl Fischer titration.”
- Yaws, C. L. and P. M. Rane, “How temperature affects H2O solubility in alkanes,” Oil & Gas Journal, Vol. 108, Iss. 46, 2010.
- Amovilli, C. and F. M. Floris, “Solubility of water in liquid hydrocarbons: a bridge between the polarizable continuum model and mobile order theory,” Physical Chemistry Chemical Physics, Vol. 5, 2003.
- Ruelle, P. and U. W. Kesselring, “Nonlinear dependence of the solubility of water in hydrocarbons on the molar volume of the hydrocarbon,” Journal of Solution Chemistry, Vol. 25, 1996.
- Black, C., G. G. Joris and H. S. Taylor, “The solubility of water in hydrocarbons,” Journal of Chemical Physics, Vol. 16, 1948.
- Maczynski, A., M. Goral , B. Wisniewska-Goclowska, A. Skrzecs and D. Shaw, “Mutual solubilities of water and alkanes,” Monatshefte fur Chemie, Vol. 134, 2003.
- Goldman, S., “Determination and statistical mechanical interpretation of the solubility of water in benzene, carbon tetrachloride, and cyclohexane,” Canadian Journal of Chemistry, Vol. 52, 1974.
- Henn, A. R. and W. Kauzmann, “New considerations of the Barclay-Butler rule and the behavior of water dissolved in organic solvents,” Biophysical Chemistry, Vol. 100, 2003.
- Énglin, B. A., A. F. Platé , V. M. Toglokov and N. A. Pryanishnokova, “Service properties of fuels and oils: Solubility of water in individual hydrocarbons,” Kimiya i Tekhnologiya Topliv i Masel, Vol. 9, 1965.
 |
JOSEPH J. PUTHUVELIL works as a Senior Scientist in the SAOO technical support department of Saudi Aramco and has been with the company for almost 8 yr. He holds an MS degree in chemistry and a PhD in environmental science from Cochin University of Science and Technology (CUSAT) in India. He has 23 yr of analytical experience in the oil and gas, power plant, chemical and petrochemical industries. Dr. Puthuvelil specializes in separation science (i.e., chromatography) and has worked on analytical investigations of gas and liquids, including water and solids. He has also given presentations at several national and international conferences and has published papers in local and international journals. He is a member of the Society of Petroleum Engineers (SPE).


Comments