
Verification of SWS performance and capacity restoration
A book by Lieberman1 stresses that it is essential to make existing units work adequately and efficiently. Equipment that malfunctions or operates inefficiently limits production and does not permit optimal energy and equipment utilization. This, in turn, leads to higher environmental degradation, not to mention plant downtime and lost production costs. Lieberman concludes that good troubleshooting and adequate repair of malfunctioning units are central to efficiently utilizing available resources.1
Due to an increase in the produced water feedrate at a Saudi Aramco gas plant, there was a need to install a new sour water stripper (SWS) unit to accommodate additional produced water. Based on operational experience, the existing SWS was not performing as required, and a plan was made to install a new SWS to accommodate the total sour water feedrate. The validation of the actual capacity of the existing SWS was important to confirm the processing capacity of the new SWS unit under new project investment. An assessment was conducted through design review and process simulation. Additional verification was performed by conducting field capacity tests jointly with the gas plant and the lab team.
Based on the assessment findings, it was concluded that the existing SWS unit was capable of handling 5,000 bpd of sour water as per nameplate capacity, while maintaining H2S specification in the treated water. Although the existing SWS unit is capable of processing the sour water feed at its original design capacity, some challenges, limitations, design deficiencies and key operational issues needed to be addressed to sustain performance in the unit. Based on the assessment study, it was recommended to utilize the existing SWS with proposed design changes and to install a new, smaller SWS to treat the additional water stream. This approach resulted in CAPEX savings for the company.
The authors present their experience and lessons learned with the SWS that initially failed to achieve its design goals due to multiple issues. The problems were correctly identified in a short, systematic and effective investigation that combined field measurements and testing with efficient hydraulic analysis. The unit was successfully repaired and optimized, which helped the company avoid a CAPEX investment.
Process description. Produced water is water trapped in underground formations that is brought to the surface along with oil or gas. It is the largest-volume byproduct or waste stream associated with oil and gas production. Management of produced water presents challenges and costs to operators. Sour water must be processed, typically in an SWS, before it can be used or disposed of in a variety of ways.
The typical inlet area facility at gas plants (FIG. 1) is designed to receive the raw feed gas with associated hydrocarbon condensate and water from multiple wells. The first equipment in the inlet area is a slug catcher, which separates the bulk of the water and hydrocarbon condensate from the gas phase. The separated hydrocarbon condensate is stabilized in the condensate stabilizers to achieve the required true vapor pressure (TVP) and then injected into the neat condensate line. The SWS is used to treat sour water flowing from the boot side of the slug catchers and three-phase separators.
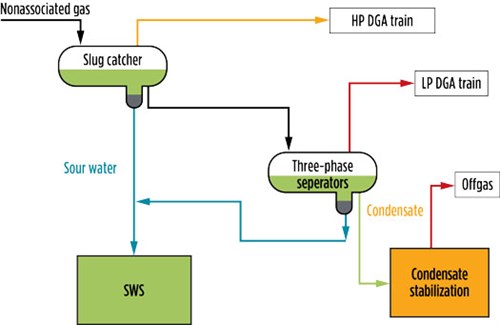 |
| FIG. 1. Inlet area slug catchers and three-phase separators. |
The main function of the SWS is to strip out acid gases (H2S and CO2) from the sour water where the acid gases are being recovered in the acid flare through the flare gas recovery system (FGRS). Treated water is routed to an evaporation pond after being treated in a pre-flash drum and an SWS, as shown in FIG. 2. Water from the slug catcher is collected in a single header and flows to the pre-flash drum to facilitate hydrocarbon separation. Acid gas flashing (mainly H2S) takes place at a pressure of 65 psig.
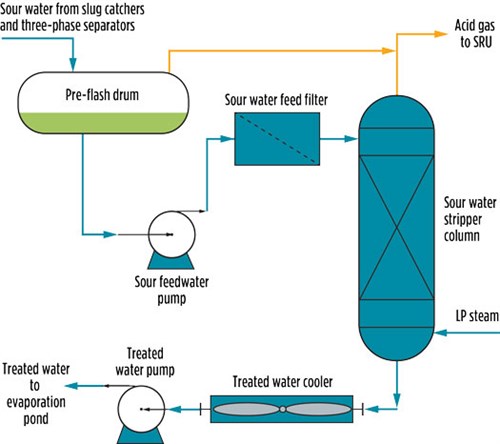 |
| FIG. 2. Simplified PFD for the SWS. |
Water flows from the bottom of the pre-flash drum. During normal operation, water is pumped through a feed filter and then enters the top section of the SWS column. The column was equipped with random packing with a height of 10 ft. Feed entered at the top inlet nozzle. The column was designed to operate with a pressure of 31 psig at the top and 34 psig at the bottom, corresponding to temperatures of 226°F at the top and 275°F at the bottom. These conditions were sufficient to achieve a specification of less than 10 ppmw H2S in the bottom product.
In the stripping section of the SWS column, the sour water is contacted counter-currently with the steam to free the H2S and CO2. This sour water feed flows downward in the column, and steam is injected into the column to strip out the acid gases from the sour water. The steam injection rate to the SWS is controlled by monitoring the column overhead temperature. As the temperature increases, the steam flow decreases. Acid gases from the stripper column are combined with acid gases leaving from the sour water pre-flash drum to the acid flare header and recovered in the FGRS. Water, leaving the column from the bottom side, flows to the evaporation pond with H2S < 10 ppmw, as per company standard.2
Initial unit operation. A standalone SWS unit was installed at a gas plant to treat the produced water at the facility, but it was not performing as required. As per actual unit operation, the column feed flowrate was running at very low rates compared to the design rate of 5,000 bpd. At approximately 40%–50% of the design feedrate, the treated water started to go off specification, and the column pressure started to fluctuate. The top temperature fell dramatically, and the column pressures fell from their setpoints of 31 psig/34 psig. The only way of bringing the tower back under control was to reduce the column feedrate. The column was gradually brought back up to design temperature and pressure.
Several attempts were made (with small variations) to increase the feed to the design flowrate. Each attempt resulted in the same scenario, as previously described. The operating behavior and distributed control system (DCS) data were closely reviewed to establish the root cause of the problem. At feed flowrates below 1,000 bpd, the column ran without issue, with all parameters in the correct operating range. As the column feedrate increased above 1,000 bpd, an upset occurred in column pressure drop across the packing. Initially, the operators observed a rapid increase in pressure drop followed by an equally rapid fall. These peaks became more dramatic as the column feed increased, until the product went off specification.
The sudden changes in column pressure drop are a primary symptom of flood. Pressure fluctuations and a drop in the overhead temperature are also symptoms of flood. Fluctuations in the column sump level, which followed the pressure drop fluctuations, were also noticed and provided an additional symptom of flood. It was concluded that above a certain feed flowrate, the column became flooded. At this stage, the cause of the operational upset was unknown since the column was designed to operate under a much higher feed flowrate.
Study objective. The objective of the study was to assess and restore the performance of the existing SWS at the gas plant to process the sour water according to its design capacity. This study highlights the main findings and recommendations to resolve the major challenges of the SWS unit operation.
Sour water stripping is a process in which either external steam or steam generated by a reboiler—or even a hot hydrocarbon stripping vapor—is used to shift chemical reaction equilibria by heating the sour water.3 The steam is the “gaseous solvent” used to remove and carry H2S out of the system. In other words, the application of heat generates internal stripping steam (equivalently, live steam injection can be used) and carries ammonia, H2S and CO2 out of the water by:
- Heating the sour water feed to boiling point
- Reversing chemical reactions
- Diluting the partial pressure of the gases stripped by furnishing excess steam.
The process is similar to an amine regenerator; however, SWS does not form a fully closed loop like an amine regenerator does, so maintaining a water balance is unnecessary. This means that direct steam injection can be used as a stripping agent, either alone or in conjunction with a conventional reboiler, and the surplus water added by the condensate is simply added to the plant’s water inventory. Typical energy usage in the stripping process is in the range of 1 lb–1.5 lb of 50-psig-equivalent saturated steam per gallon of sour water.
Study findings and results. This assessment was completed by systematic investigation combining simulation with hydraulic analysis and actual field testing. Multiple simulation cases were performed, using a mass transfer model in a proprietary simulator to assess the maximum sour water processing capacity of the SWS system.
As per general guidelines, SWS calculations have been performed, using ideal stages in the Equilibrium Model.4 Ideal stage calculations provide a fast and accurate means to quantify the trade-off between the number of trays and the stripping steam. In this case, the real number of trays and lengths of packed bed were used since this is an existing column; this gives the Mass Transfer Model.
In the Mass Transfer Model, the actual rates of mass and heat transfer between the phases in the column are used. The mass and heat transfer coefficients and interfacial area are based on vapor and liquid diffusivities, viscosities, densities, heat capacities and thermal conductivities. To estimate mass transfer coefficients, detailed information about the column internals is required. This information includes column diameter, surface area per unit volume and void fraction for packing. FIG. 3 shows the model for the SWS.
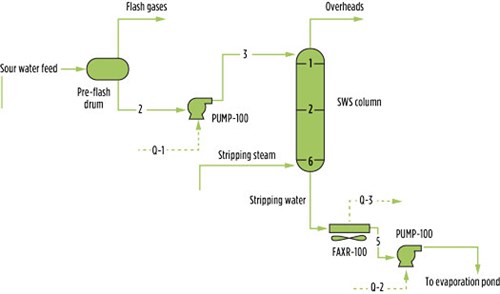 |
| FIG. 3. Simulation model for the SWS. |
A Peng–Robinson equation of state was used, as only H2S is present in the sour feedwater. For systems that contain only a weak acid or a weak base, such as the binary systems H2S–H2O or NH3–H2O, molecular models are sufficiently descriptive to model the system behavior. Examples of molecular models are the cubic equations Peng–Robinson and Soave–Redlich–Kwong, as well as any activity coefficient models that account for only molecular species. This acid-only case is a special case, and care must be taken when modeling a sour water system. The equations are not capable of describing the behavior when both an acid and a base are present. An electrolytic model is needed to account for the ionic interactions of the dissociated species in acid-base systems, and can be used for an acid-only system, as well.
FIG. 44 shows the relation between the steam injection rate and H2S in treated water. It illustrates the effect of varying the steam rate on the stripped water composition. The amount of steam used has a major effect on the composition of the stripped water. The H2S concentration decreases rapidly as the steam rate increases. NH3 concentration also initially decreases rapidly until it is influenced by the acid-base chemistry of NH3 and HCN. The HCN concentration is initially insensitive to steam rate and remains constant. Once the NH3 concentration decreases sufficiently, both NH3 and HCN can be stripped. However, if phenol ionizes in the water, then significant removal by stripping is difficult.
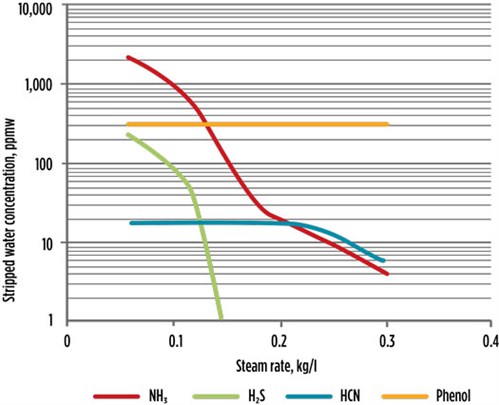 |
| FIG. 4. Steam injection rate and H2S in treated water. |
The solutes to be removed are weak electrolytes that are partially dissociated into ions in solution. Therefore, the phase equilibrium of each weak electrolyte in solution plays an important role in the removal of pollutants from sour water through steam stripping. The main feed components in this system are H2O and H2S. Henry’s law is applied to these components in the simulation because they are light gases. The reactions that occur when H2S and CO2 dissolve in solution are the same as in any other aqueous solution. The reactions shown in Eqs. 1–6 are of interest for this study:3
H2O ←→ H+ + OH– (1)
H2S ←→ H+ + HS– (2)
HS– ←→ H+ + S= (3)
CO2 + H2O ←→ H+ + HCO3– (4)
HCO3– ←→ H+ + CO3= (5)
NH3 + CO2 ←→ NH2COO– + H+ (6)
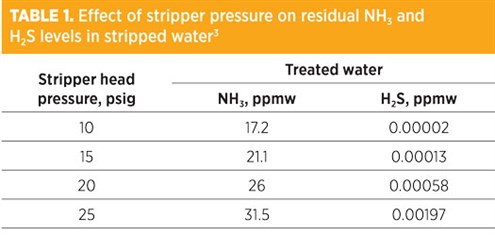
Effect of stripper pressure. It is sometimes said that higher stripper pressures favor sour water stripping. The experimental data presented in Reference 3 and the gas plant actual field tests show that higher pressures do not seem to favor ammonia stripping, and they certainly have a negative effect on stripped water quality in terms of H2S.
TABLE 1 shows the effect of column head pressure on residual ammonia and H2S levels in stripped water.3 The simulated performance corresponds to a steam rate of 25,000 lb/hr of 50-psig steam (1.4 lb/gal), with the cross-exchanger set to a temperature approach of 20°F to minimize the effect of temperature differences across the stripping section. TABLE 1 shows that a higher pressure has a negative effect on water quality with respect to ammonia, and can cause a significant increase in residual H2S content of the stripped water under these conditions.
 |
Simulation cases. Case 1 examined SWS column efficiency at 100% and the steam rate as per the unit process flow diagram (PFD). FIG. 2 showed the simplest configuration of the existing SWS at the gas plant. The unit is equipped with a stripper column containing 2-in. flexi rings (metal packing) with a 10-ft-high packing bed using six trays. Sour water was fed to the column from the top, and live steam saturated at 60 psig entered below the bottom of the packing. The column was sized for 85% of jet and downcomer flood in all cases.
Case 1 was performed under the assumption that the system efficiency was at 100% (used all column trays to match the efficiency) and that all system components (including the vessel, pumps, filters, exchanger and column internals) were working as per the original design with maximum efficiency.
Based on the simulation results, FIG. 5 shows the trend lines for H2S content in treated water, as well as the steam injection rate to the SWS, while maintaining the column temperature and pressure conditions as per the process flow diagram data. The simulation results for Case 1 show that the existing SWS unit is able to meet H2S in the treated water specification at a maximum efficiency of column internals.
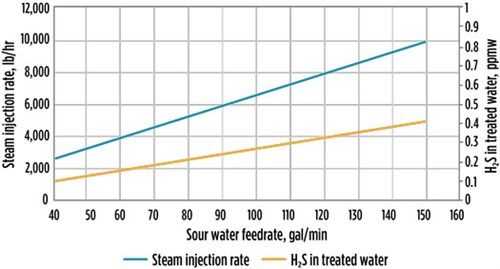 |
| FIG. 5. H2S in treated water vs. steam injection rate for Case 1. |
Case 2 examined SWS column efficiency at 85% and a steam rate as per the unit PFD. Case 2 was performed with the assumption that the SWS column internal efficiency was at 85% (with a smaller number of trays to match the 85% column efficiency) due to solids buildup and fouling issues in the system, while other unit operating conditions remained as per the unit PFD. Under these conditions, multiple simulation runs were carried out to check the unit performance, which shows that the system is still able to meet the treated water specification (FIG. 6). This indicates that the system was originally designed with sufficient margin.
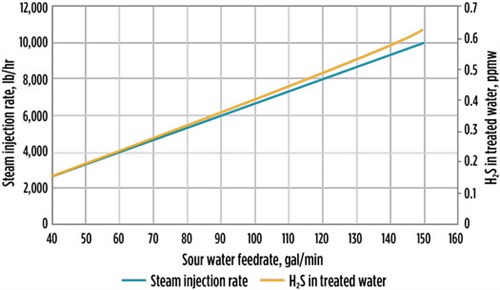 |
| FIG. 6. H2S in treated water vs. steam injection rate for Case 2. |
Case 3 examined SWS column efficiency at 85% and a steam rate at 15% higher than that specified on the unit PFD. Another sensitivity simulation was conducted at a column efficiency of 85% and a steam/water ratio increase of 15% over the design ratio, while the operating pressure increased to 40 psig from 31 psig. This simulation run was conducted to match the column actual operating conditions and cover any uncertainties in the simulation model. With these conditions, the column top operating temperature was increased to 275°F compared to 229°F (the PFD value), which matched the actual field test. Note: This high operating temperature is still below the maximum design temperature of 400°F. Under these conditions, the system is still able to meet the treated water specification (FIG. 7).
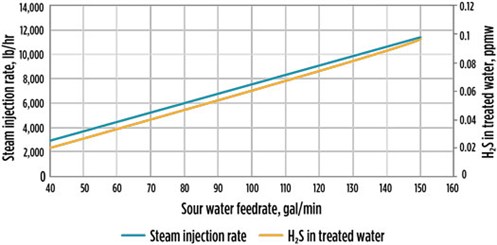 |
| FIG. 7. H2S in treated water vs. steam injection rate for Case 3. |
Actual field test. The actual performance tests of the SWS unit were conducted multiple times to confirm the simulation findings.
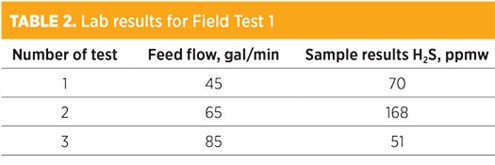
Field Test 1 showed off-specification treated water due to a significantly lower steam supply to the unit of less than 12 lb/hr steam (0.2 lb steam/gal of water) compared to the design supply of 63 lb/hr steam (1.05 lb steam/gal water). Note: During this test, a number of main equipment pieces were not available, including filters, the sour water feed pump and the treated water pump. Furthermore, the system was operated manually. TABLE 2 shows the results extracted from the lab report for Field Test 1. The recommendation was to repeat the test at a higher steam supply, which was implemented for Field Test 2.
 |
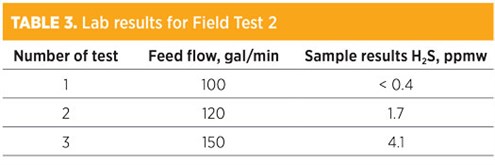
Field Test 2 was conducted at a higher steam rate of approximately 48 lb/hr steam per 1 gal/min feedwater, which is 0.75 lb steam/gal water. The results showed that the H2S in treated water was on specification. However, the system was not stable due to both the feed and treated water pumps not being in service. TABLE 3 shows the results extracted from the lab report for Field Test 2.
 |
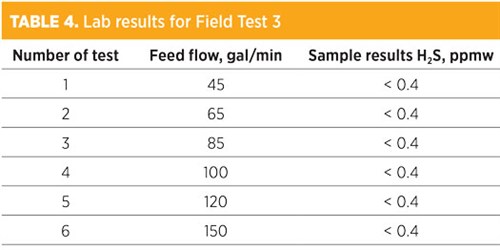
For Field Test 3, the test was repeated with a similar high steam rate (average of 45 lb/hr steam per 1 gal/min water, which is 0.75 lb steam/gal water) as in Field Test 2, while both the feed and treated water pumps were in service. The test was very successful, with all test points up to 150 gal/min (about 5,000 bpd) showing that the H2S in treated water was within the limit and that the system was stable and under auto control. TABLE 4 shows the results extracted from the lab report for Field Test 3.
 |
During Field Test 3, it was observed that the actual steam injection rate was lower than the recommended unit PFD value, as shown in FIG. 8. In addition, the column top temperature was higher than the unit PFD, even though the steam injection rate was lower. The simulation results shown in FIG. 7 supported the actual test results. The calculated steam injection was slightly higher than the actual steam injection, which can be attributed to the column internals or the correlation used in the simulation.
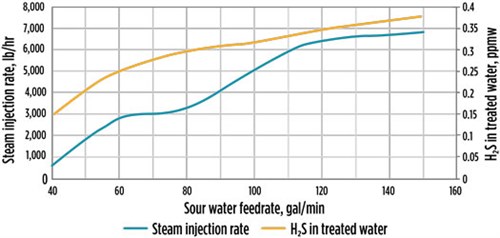 |
| FIG. 8. H2S in treated water vs. steam injection rate for Field Test 3. |
Health checks for process equipment. Based on unit simulation runs and actual field tests, the following observations were recorded for each piece of SWS equipment:
- Pre-flash drum: The vessel was working normally, with operating pressure as per PFD conditions. The frequency of sand jetting occured only once a week, which was not sufficient to effectively remove the sludge accumulation in the pre-flash drum and downstream equipment.
- Sour water filter pump: The pump was still being operated with a temporary suction strainer. In addition, only a single pump was available onsite without any standby, which limited the unit operation in case of failure on the pump.
- Sour water mechanical filter: Only one filter was provided with the bypass line for the sour water stripper column, which was not adequate due to high solids content in the sour water. Frequent cleaning and filter change-out are required for this filter. Furthermore, during the isolation of this filter, solids accumulated in the stripper column, which created fouling in the stripper column and reduced its performance.
- Sour water stripper column: Pressure control was not working properly for the stripper column while it was running on manual control. Also, the reflux pump experienced some issues due to solids in the water, which made the column operation unstable and caused difficulty in controlling the pressure and level in the column.
- Treated water pumps: The pumps were not running due to a mechanical issue, which was fixed for Field Test 3. Also, a temporary suction strainer was installed that caused a blockage with solids, creating cavitation.
- Process control system: During Field Test 1 and Field Test 2, it was observed that the system was unstable in manual mode. This instability was mainly due to the fact that the feed and treated water pumps were not in service to maintain column pressure to drain the treated water to the evaporation pond. During Field Test 3, the SWS unit ran stable on auto mode, when all feed and treated water pumps were in operation.
Integration of existing SWS with new SWS train. Based on the actual performance test and a desktop study of the existing SWS train, it was recommended that a new, smaller SWS train should be provided with all tie-in points to the existing SWS. This would allow operational flexibility during normal operations, as well as during maintenance, turnaround and inspection. FIG. 9 provides the equipment design capacity for a new SWS train and its integration with the existing SWS. The scope of work for integration under the new project is shown in dark blue color.
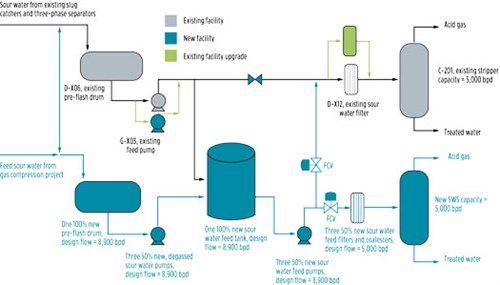 |
| FIG. 9. Simple sketch for integration of existing SWS with new SWS train. |
Lessons learned. Based on the assessment findings from the process simulations and the actual field performance tests, it was concluded that the existing SWS unit is capable of processing 5,000 bpd of sour water as per nameplate capacity, while maintaining specification for H2S in the effluent water.
Although the existing SWS unit is capable of processing the sour gas feed at its original design capacity, the following design deficiencies and key operational issues for this unit needed to be addressed to sustain the performance:
- High solids loading in the sour water feed contaminated the system, which impacted the overall performance of the unit
- Manual operation mode was identified as one of the main challenges to maintaining stable operation of the SWS, especially at maximum design rates.
This study also produced several takeaway messages related to sour water stripping:
- Proper cleaning is required to remove the solids in process equipment that impact SWS operations
- The SWS should be operated in auto mode, with both the sour feedwater and treated water pumps in operation
- The SWS column operating temperature should be controlled as per the design data, by maintaining the ratio of steam flowrate to sour water flowrate close to the design value. GP
LITERATURE CITED
- Lieberman, N. P., Process Engineering for a Small Planet, Wiley, Hoboken, New Jersey, 2010.
- Saudi Aramco engineering standard for sour water stripper design, SAES-A-16, GPSA, Sour water stripper design.
- Weiland R. H. and N. A. Hatcher, “Sour water strippers exposed,” Laurence Reid Gas Conditioning Conference, Norman, Oklahoma, February 28, 2012.
- Addington, L., C. Fitz, K. Lunsford, L. Lyddon and M. Siwek, “Sour water: Where it comes from and how to handle it,” Digital Refining, September 2011.
- Ponting, J., H. Z. Kister and R. B. Nielsen, “Troubleshooting and solving a sour water stripper problem: A systematic approach identifies problems that prevented a stripper column from achieving trouble-free operation,” Chemical Engineering, Vol. 120, Iss. 11, November 2013.
 |
MUHAMMAD RIZWAN TARIQ is a Senior Process Engineer at the process and control systems department of Saudi Aramco in Dhahran, Saudi Arabia. He has also served as Staff/Senior Engineer at JGC Japan, Worley Oman, PDO Oman and OGDCL Pakistan. He holds a BS degree in chemical engineering from Punjab University in Lahore, Pakistan. He is also a Chartered Member of IChemE UK and a Professional Engineer with PEC Pakistan.
 |
TAIB ABANG is an Engineering Specialist at the process and control systems department of Saudi Aramco in Dhahran, Saudi Arabia. He has also served as a Senior Engineer at Petronas LNG in Malaysia. He holds a BS degree in chemical engineering from University Malaya in Kuala Lumpur, Malaysia. He is a Chartered Engineer from the Engineering Council and a Chartered Member of IChemE UK.


Comments