
U.S. Industry Metrics
3/1/2021
Full-year 2020 data for LNG exports from the U.S., released by the EIA in March, show that U.S. LNG exports averaged 6.6 Bft3d on a yearly basis and increased 1.6 Bft3d (32%) year-on-year. Export levels were high from January–May and began to increase again in October–December after a record-low summer slump. The late-year increase was largely due to extremely cold weather and unplanned outages at LNG export facilities in several countries, which caused Asian LNG spot prices to climb. LNG exports also increased due to the addition of export capacity at U.S. terminals including Freeport, Cameron, Corpus Christi and Elba Island. GP
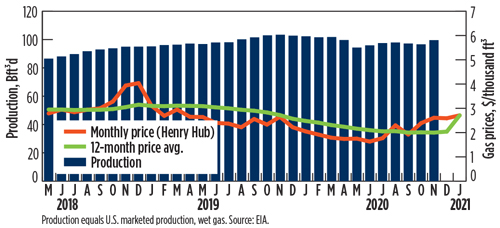 |
| U.S. gas production (Bft3d) and prices ($/Mcf) |
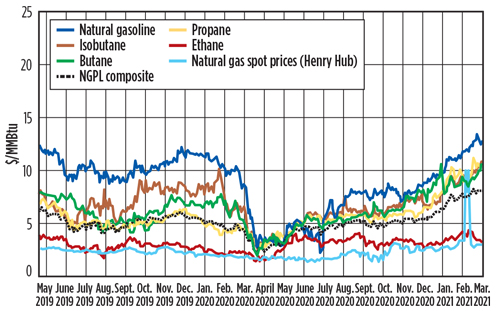 |
| U.S. natural gas spot prices at Henry Hub and NGL spot prices at Mont Belvieu, $/MMBtu |
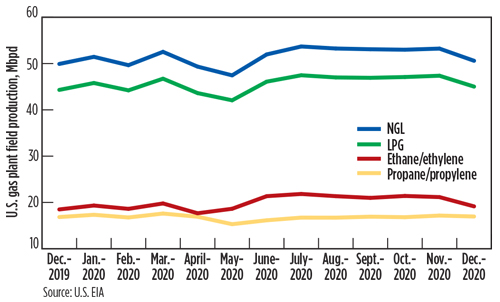 |
| U.S. natural gas plant field production of NGL, LPG, ethane and propane, Mbpd |


Comments