
The smart gas plant: An integrated, intelligent gathering and processing super system
Midstream operators typically own both the gathering networks that transport natural gas and the downstream treating and processing facilities that convert this raw feed into marketable products, such as residue gas and Y-grade NGL.
The optimization of both the gathering system and processing facilities—with their multitude of associated meters, commercial contracts and variable commodity pricing—in an integrated fashion is challenging to carry out in real time. System size, complexity and data requirements can complicate the real-time optimization of these facilities.
However, the overall benefits of this optimized natural gas gathering and processing super system can be significant in terms of lower operating and maintenance expenses, increased reliability and asset utilization, higher-value product recovery rates, and increases in effective system capacity.
The heart of this integrated super system is the smart gas plant, a fully realized, operational digital twin of the plant. When combined with other operational digital twins for the compressors, meters and pipelines, an integrated, intelligent super system is created.
This article describes the use of an operational data infrastructurea in configuring a smart gas plant for real-time monitoring and optimization of plant operations, as a first step in creating an integrated super system. The super system enables the optimization of the complete gathering and processing system, comprising many gathering networks and an associated fleet of processing plants, with optionality to gate natural gas to several gas plants based on optimal guidance.
Gas plant operational challenges. The gas plant is the heart of a gathering- and processing-focused midstream operator’s asset portfolio because of its role as the treating and processing hub, which receives raw gas from the gathering network, removes contaminants such as H2S, CO2 and water in amine and glycol units, and separates NGL and sales gas in a cryogenic unit.
The challenge for gas plant operators is to optimize plant uptime and equipment maintenance to ensure consistent, optimum and high-quality sales gas and NGL production rates, while balancing numerous issues, including:
- Feed gas rate composition/quality variability
- H2S and CO2 concentrations exceeding environmental limits
- Running the cryogenic unit in ethane recovery or rejection mode
- Controlling residue gas heating values
- NGL composition ratios, such as C1/C2 and CO2/C2, as well as fluctuating methane, ethane and propane prices.
The capability to carry out this analysis for gas plants and act in near-real time, vs. an offline weekly or monthly reactive approach, is essential for responding rapidly to operational and price/market fluctuations, as well as optimizing production. Near-real time, financial-based optimization of a single gas plant train can yield $2,500/d–$3,000/d (approximately $1 MM/yr), and up to 1.5 times this amount per gas plant in a gathering and processing super system.
Extracting actionable insights and optimizing gas plant performance is challenging due to the large and diverse amount of operational, meta and financial data from disparate sources: distributed control systems (DCSs), programmable logic controllers (PLCs) and other sensors; financial/pricing databases; commodity pricing and enterprise resource planning (ERP) platforms; computerized maintenance management systems (CMMS); plant process simulation tools; and many others. Examples of such data types include:
- Plant process sensor data, such as temperature, flow, pressure, concentrations, etc. from the DCS
- Raw gas quantity, quality and gathering system information
- Manufacturer equipment performance curves and related engineering data
- Plant asset maintenance records
- Plant process simulation models that are validated and provide optimal operating targets
- Financial information associated with methane, ethane and propane pricing from multiple sources, including a multitude of contracts and commodity pricing.
An operational data infrastructurea is a key foundational tool to enable the creation of a smart gas plant. An operationally intelligent operational digital twin of the physical gas plant can turn these disparate data sources into actionable operational intelligence and decision support. This digital infrastructure empowers engineers, operators, maintenance personnel and subject matter experts (SMEs) to configure, evolve and manage their gas plant decision support application directly, using the data infrastructurea with “no-code” digital twins.b This is in contrast to the more traditional approach of developing or purchasing a customized digital solution for gas plant operations with significant IT involvement, associated customization and challenging sustainment effort.
Real-time decision support. The smart gas plant is based on an integrated, hierarchical set of configurable dashboards that enables self-serve, contextualized access to operational intelligence, using a modern, web-enabled visualization platform.
As a best practice, the smart dashboard should have a rolled-up summary of all gas plant information, including integration with geospatial, safety and environmental information, with the ability to drill down through the portfolio of smart displays. The smart displays should leverage exception-based, conditional formatting to communicate equipment status efficiently and effectively.
FIG. 1 is an example of a smart display developed for a midstream company with several gas plants in its asset portfolio. This smart display was configured by dragging and dropping desired plant attributes from a gas plant asset hierarchy onto a smart display canvas. As no programming or coding is required, end users can customize their own smart displays or rely on standard, enterprise-level smart displays. This display also has a conditionally formatted geospatial map layered with real-time information, such as plant production rates. By selecting a region on the map, further drill-down details and intelligence can be accessed.
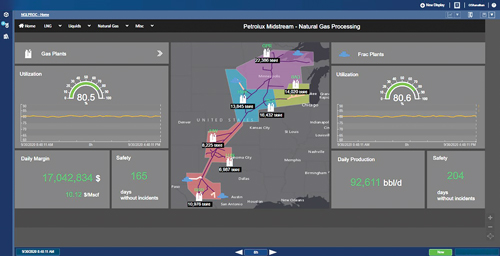 |
| FIG. 1. Example of a smart, configurable gas plant summary dashboard. |
Additionally, the summary dashboard has rollup KPIs, such as overall plant utilization and production, which are configured and managed by the plant SMEs. The web-based dashboard also showcases financial KPIs, such as daily total margin and margin per million standard cubic feet (MMsft3) of feed gas. Other information, such as safety days, can be linked from associated data sources.
A user can drill down from this summary display to view a block diagram and operating KPIs for each individual gas plant in a specific region, such as NGL and residue gas production rates, ethane and propane recoveries, as well as C1/C2 and CO2/C2 component ratios (FIG. 2). By selecting a block, a process flow diagram (PFD) of the unit with real-time process values can be viewed.
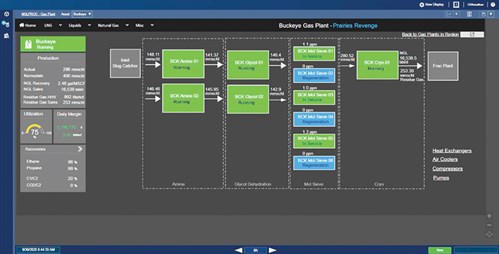 |
| FIG. 2. Plant block diagram showing different gas plant units and operating KPIs. |
Since the display shown in FIG. 3 is referencing an amine unit that uses an underlying “no-code” digital twin template,b the user can easily configure this dashboard for one amine unit and then reuse it for all other amine units in the asset portfolio without modification. This capability significantly reduces smart display creation and management workloads.
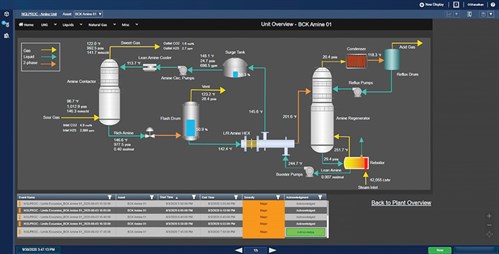 |
| FIG. 3. Process display of an amine unit with environmental excursion events. |
This display also shows environmental excursion events, specifically when the outlet H2S concentration from the amine contactor exceeds 4 ppm, which is an emissions limit. These environmental excursion periods can be automatically created by defining a rule-based start and end event analytics. Another powerful capability is “backcasting” these event analytics (or any expression) on high-fidelity historical data to enable insight into when the defined event occurred in the past. These events can automatically trigger notifications to the operators, SMEs and other relevant parties or workflows to external systems, such as work order creation.
For maintenance personnel, equipment-centric views into all heat exchangers, air coolers, compressors and pumps in a gas plant can be developed. When an asset class, such as a heat exchanger, is selected from the list in FIG. 2, a display listing all relevant operating KPIs for each exchanger can be configured with exception-based reporting rules to visually indicate which exchangers need attention (FIG. 4).
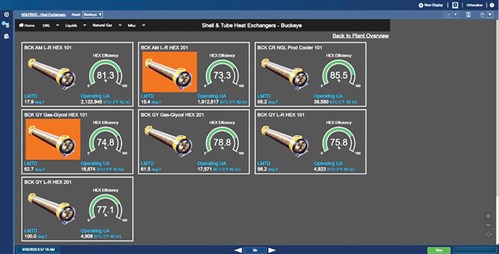 |
| FIG. 4. Exception-based equipment reporting display for all heat exchangers in a gas plant. |
The gas plant digital twin becomes increasingly “smart” when integrated with a robust plant process simulation tool that has validated models of all necessary plant units. Model intelligence is further enhanced by bi-directionally integrating real-time plant DCS/sensor data from a historian as inputs to the simulation model and historizing the simulation results to perform real-time comparisons between simulation and operating parameters or validating the model. The display (FIG. 5) illustrates ethane and propane recovery comparisons from both real-time and simulated data. The live link between the operating and engineering models, coupled with financial data (e.g., ethane and propane spot pricing), enables real-time, recovery-based financial performance optimization to be implemented in the smart gas plant.
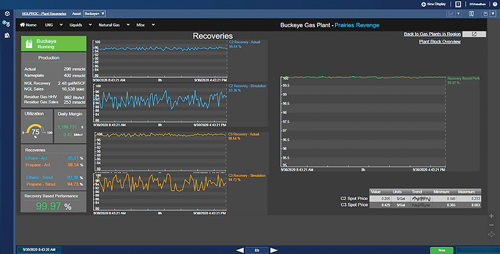 |
| FIG. 5. Comparison of C2 and C3 recoveries from operating and simulated data, with recovery-based financial performance optimization. |
Portfolio and fleet-wide gas plant business intelligence. Once this recovery-based financial performance optimization methodology is developed for a single gas plant, it can then be applied throughout the plant portfolio in a midstream company. Fleet-wide business intelligence (BI) dashboards can be developed by streaming this data in real time to tools such as Microsoft Power BI, Tableau or Spotfire.
Users can quickly view these recovery values vs. model-validated targets for all plants in a central display, taking advantages of features such as slicing and dicing in these BI platforms to understand portfolio performance and take appropriate actions.
Creation of a gathering and processing super system. Once the portfolio of gas plants has near-real-time optimization, the same strategy and methodology can be extended to pipeline gathering assets, including associated systems, such as compressor stations and meters, to build a smart pipeline system.
The smart digital replica of the gas plants and the digital replicas of the associated gathering systems can be combined to form an integrated, intelligent gas gathering and processing super system (FIG. 6). By leveraging the super system optionality, such as gating a gathering system to the most optimal gas plant, the gathering and processing operator can gain as much as 1.5 times of financial performance across the super system vs. optimizing a single gas plant.
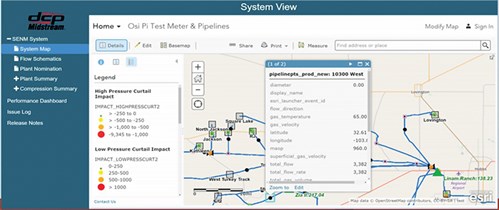 |
| FIG. 6. An integrated, intelligent gas gathering and processing super system, combining smart gas plants with digital pipelines.1 |
Several gathering and processing operators have reported an increase in super system effective capacity by more than 3%, enabling the idling of low-efficiency gas plants or the ability to secure additional gathering and processing volumes.
This integrated super system can now be utilized to holistically monitor and optimize the entirety of a midstream operator’s asset portfolio. The super system helps maximize production and financial returns, minimize costs and ensure safe and reliable operations, leading to optimum gas volumes and routing from the gathering network to high-efficiency gas plants based on spot prices. In addition, based on this super system, management decisions can be made to either sell or idle under-performing or low-efficiency plants that are not needed based on gas demand and present contract pricing.2
Real-time operational data infrastructure. The real-time operational infrastructurea is an agnostic, open, scalable and reliable technology specifically designed for critical operations. It enables several key functionalities:
- Secure integration of time-series operational data from DCS, supervisory control and data acquisition (SCADA) and Industrial Internet of Things (IIoT) systems
- Abstraction of diverse tag and asset names into a standard company lexicon
- Integration of metadata, including engineering data and the maintenance management system
- Normalization of units of measure, time zones and descriptions
- Configuration of traditional operational applications, such as energy management, environmental compliance and KPI-driven dashboards
- Use of a “layers of analytics” framework and strategy providing the analytics foundation via descriptive, diagnostic and simple predictive analytics.
No-code digital twins. A digital twin is a replica of a physical asset, such as a heat exchanger, a pump or a compressor comprising attributes, calculations, KPIs, empirical correlations and models of varying complexity. Contrary to the present hype, digital twins have been around since the 1960s. However, today’s operationally focused digital twins are dramatically more robust and sophisticated in their ease of use, approach and capability to develop, evolve and leverage in a smart gas plant.
Most digital twins require information technology (IT), data scientists, machine learning, model integration and coding. They also have a limited ability to deal with data volume, velocity, variability and anomalies. They are difficult to scale and struggle to address the anomalies of physical assets that have variability in vintage, make, model and level of instrumentation. Furthermore, real-time operational data and asset metadata (i.e., static information like equipment model and location) typically reside as tags in control systems, as well as in other databases and platforms, with accessibility issues and lack of naming standards limiting access to critical data that could potentially be leveraged to gain insight.
However, one operations-focused digital twin technologyb has access to this required data with the ability for the SMEs to configure replicas of their gas plant components, such as columns, heat exchangers, pumps, compressors and air coolers in an agile, evolutionary way. These no-code digital twins rely on digital asset templates and can be combined like LEGO blocks to form a comprehensive digital representation of physical gas plant and gathering and processing system, using drag-and-drop capabilities (FIG. 7).
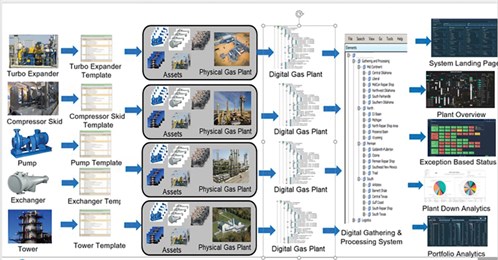 |
| FIG. 7. A smart gas plant configuration from digital twin asset template building blocks. |
The digital operational infrastructure can enable asset anomaly detection by empowering the SME to create or modify anomaly expressions and then test the expressions by backcasting—i.e., running the expression back into the operational history. Once satisfied with the expression, the SME can then forward-cast this modified expression or event detection algorithm to other assets that utilize the same digital twin template. This powerful capability enables continuous improvement of calculations, expressions and event analytics over time, as well as comparison of similar expression results, KPIs or events as part of the diagnostic process.
To be able to address the variances in equipment type, make and vintage, the digital twin templates must contain sub-templates or derived templates to capture these deviations from the base template. In the digital twin templates, the attributes are placeholders for the actual, asset-specific values that are mapped once when the template is applied to an actual asset.
A real-world data infrastructurea with no-code digital twin technologyb now operates across DCP Midstream, one of the largest midstream operators in North America. DCP Midstream has numerous gas plants, fractionation units and other midstream assets, including thousands of associated heat exchangers, pumps, and compressors. DCP Midstream’s engineers have configured more than 400 no-code digital twin templates in an evolutionary, agile way to form an operational digital twin of their entire enterprise, with more than 11,000 digital twin instances.
“Layers of analytics” strategy for gas plants. Terms such as advanced analytics, machine learning, big data and artificial intelligence (AI) appear pervasively in marketing literature today, but they can lead to confusion, failed projects and significant lost-opportunity costs.
The most successful gas plant operators achieve value from analytics by first defining an analytics framework and the types of analytics required, and then selecting fit-for-purpose technologies. They use a layers of analytics strategy, which considers incremental cost vs. incremental value as they move to more complex analytical methods. The costs include not only the technology, but also the costs associated with lost time to value, scalability, configuration, sustainment and risk of attainment.
The foundation of this layers of analytics approach (FIG. 8) relies on the use of an operational data infrastructure to enable SMEs—not IT—to configure real-time descriptive, diagnostic and simple predictive analytics using formulas, empirical correlations and rule-based expressions. These lower-level analytics form the foundation for more advanced predictive, prescriptive and adaptive analytics that use machine learning and other methods and require collaborative support from data science teams.
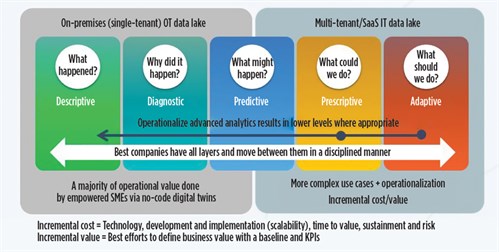 |
| FIG. 8. A “layers of analytics” strategy—disciplined evolution of analytical layers to deliver value. |
These foundational analytical layers generally provide more than 80% of the value for about 20% of the cost vs. more advanced analytical layers that use only technologies such as machine learning. Once higher layers of analytics are utilized, it is imperative to feed back the results of these advanced layers to the lower-level layers as forecasts or targets to operationalize the advanced analytical output. This is key to the development of the smart gas plant, as results from the integration with process simulation optimization models and financial data for real-time gas plant financial optimization are fed back to the operational data infrastructure.
Takeaway. Natural gas gathering and processing operators face numerous operational and market challenges that inhibit their ability to achieve optimal operating and financial performance. Leading gathering and processing companies are responding to these challenges by aggressively adopting digital technologies that enable agility, flexibility, operational excellence and proactive decision support to optimize performance through the development of smart gas plants and gathering and processing super systems.
The overall benefits of this optimized natural gas gathering and processing super system can be significant in terms of lower operating and maintenance expenses, increased reliability and asset utilization, higher-value product recovery rates resulting in $1 MM/yr per gas plant, and increases in effective gathering and processing system capacity by as much as 3%.
Adopting an operational data infrastructure with no-code operational digital twins based on a layer of analytics strategy, as well as building smart dashboards, are the keys to a successful digital transformation. The enablement of SMEs to develop, configure and evolve these no-code digital twins with minimal IT support is the secret to the smart gas plant of the 21st century. GP
NOTES
a The PI System functions as a real-time operational data infrastructure for critical operations and enables SMEs to configure no-code digital twins to create self-serve access to contextualized operational intelligence and support a layer of analytics strategy.
b No-code digital twins refer to the PI System’s Asset Framework (AF) that includes an integration, abstraction and contextualization layer via data references to other data sources; a portfolio of 110 analytical functions optimized for time-series data that leverage a wizard capability for ease of use; event framing that enables configurable event start and end times with event analytics; and a configurable notification engine to trigger alerts via SMS, email or work order in a maintenance management system.
LITERATURE CITED
- Hill, J., “DCP update on the use of the PI System,” PI World Conference, March 2019, San Francisco, California.
- Johnson, W., “DCP Midstream—Enabling business transformation with the PI System: The DCP 2.0 journey,” PI World Conference, April 2019, San Francisco, California.
 |
ANDREW NATHAN is a Senior Systems Engineer and the Midstream Oil and Gas Industry Champion at OSIsoft. He has 12 yr of experience in the oil and gas industry, specifically data infrastructure with the PI System, analytics, visualization, process engineering, plant and pipeline modeling, operator training, 3D visualization and virtual environments. He is passionate about operational performance optimization for the process industries through utilization of data infrastructure and simulation software tools. He holds a PhD in polymer science from the University of Akron in Ohio and a BS degree in chemical engineering from Michigan State University in East Lansing.
 |
CRAIG HARCLERODE is a Global Oil and Gas and HPI Industry Principal at OSIsoft. He focuses on digital-enabled business transformation addressing the dimensions of people/culture and process reengineering leveraging the PI System in the areas of IIOT/edge computing, PI AF digital twins, layers of analytics, and big data to deliver transformative business value. Mr. Harclerode’s 40-yr career has included engineering, operations and automation in supervisory, executive management and consulting roles at Amoco Oil, Honeywell IAC and Aspen Tech. He holds a BS degree in chemical engineering from Texas A&M University in College Station and an MBA degree from Rice University in Houston, Texas, and he is a former Project Management Professional. He has numerous publications to his credit and is a regular thought leader presenter at conferences and events globally on “going digital.”


Comments