
U.S. Industry Metrics
In 1H 2020, U.S. net natural gas exports averaged 7.3 Bft3d, or nearly 80% (3.2 Bft3d) higher than during 1H 2019. From January 2020 through June 2020, net LNG exports increased by almost 60% (Bft3d), net pipeline exports to Mexico increased by 4% (0.2 Bft3d), and net imports by pipeline from Canada declined by 12% (0.6 Bft3d) compared to 1H 2019. U.S. LNG imports in 1H 2020 were similar to import levels in 1H 2019, averaging 0.2 Bft3d. U.S. net natural gas exports are forecast to return to pre-COVID-19 levels by November 2020 and average above 9 Bft3d in the 2020–2021 winter. GP
 |
|
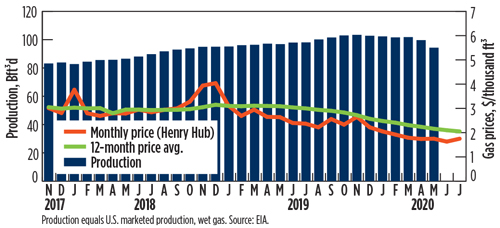
U.S. gas production (Bft3d) and prices ($/Mcf) |
 |
|
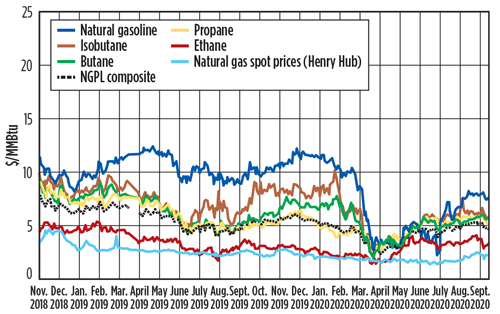
U.S. natural gas spot prices at Henry Hub and NGL spot prices at Mont Belvieu, $/MMBtu |
 |
|
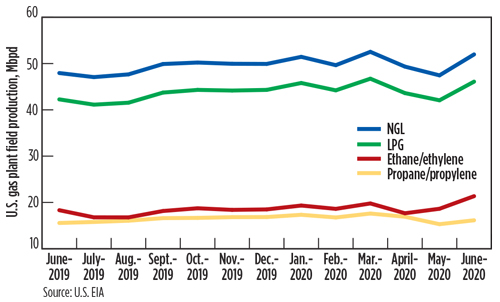
U.S. natural gas plant field production of NGL, LPG, ethane and propane, Mbpd |


Comments