
U.S. Industry Metrics
On November 4, the thousandth LNG export cargo was shipped from the U.S. since the start of LNG exports from the Lower 48 States in February 2016. An estimated 3.42 Tft3 of natural gas have been exported as LNG from the U.S. between February 2016 and early November 2019. The so-called “second wave” of LNG projects in the country includes 14 terminals worth a collective $118.4 B. The vast majority of the projects are located along the Gulf Coast. U.S. LNG production capacity is estimated at 8.9 Bft3d at the end of 2019, representing more than twice the liquefaction capacity of 3.6 Bft3d in place at the end of 2018. GP
 |
|
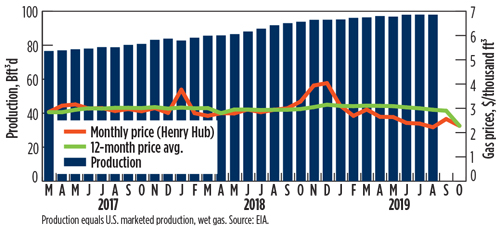
U.S. gas production (Bft3d) and prices ($/Mcf) |
 |
|
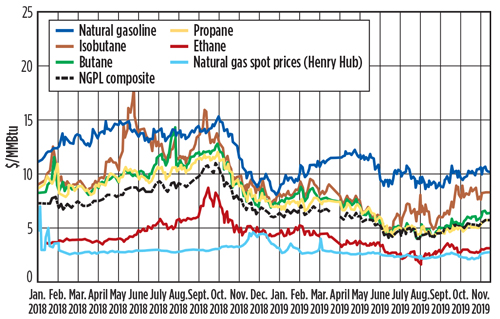
U.S. natural gas spot prices at Henry Hub and NGL spot prices at Mont Belvieu, $/MMBtu |
 |
|
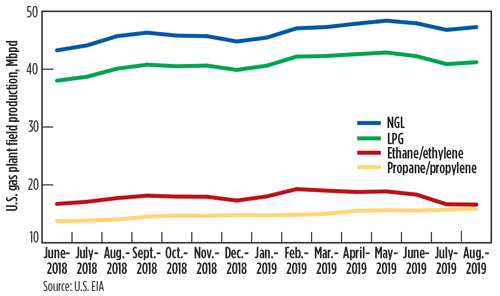
U.S. natural gas plant field production of NGL, LPG, ethane and propane, Mbpd |


Comments