
The insoluble equation: How to balance Europe’s natural gas supply and demand
The European gas industry is not a homogenous entity; it is a patchwork quilt of countries with different energy portfolios, different legislation and different energy mixes. Some are rich in hydrocarbon and renewable energy reserves, while others have few.
From this uneven starting point, the continent is bound by two common challenges that form the addends to the sum of Europe’s energy future:
- The need for more and varied energy imports, especially natural gas.
- The EU’s promise to reduce greenhouse gas emissions and improve energy efficiency under the Paris Agreement.
Other than coal, Europe is in net deficit of fossil fuels. By 2035, Europe’s gas supply mix is expected to be more heavily reliant on LNG and Russian pipeline gas, with domestic gas production falling as existing fields, particularly in the North Sea, mature.
On the climate change front, the EU is a single common signatory to the Paris Agreement and is legislated to reduce its CO2 emissions by at least 40% by 2030 compared to 1990 levels. Facing the challenges of energy balance and emissions reductions will require some difficult decisions and inevitable change. The dependence on coal in power generation and oil in transport must be reduced, to be replaced by gas/LNG and renewable energy. The decision to restrict or prevent the development of shale reserves should also be challenged.
Part 1 of the equation: Solving Europe’s import needs
In the last 10 yr, Europe’s primary energy demand has fallen by around 5%. While large growth has been seen in renewable energy, this growth has come from a small base. Fossil fuels still meet 75% of primary energy needs, with oil predominantly fueling the transport sector and gas feeding the power, residential and commercial sectors.
Natural gas accounts for roughly 23% of Europe’s energy demand. The EU imports approximately 70% of its gas demand. This figure is anticipated to climb to more than 90% over the next two decades.
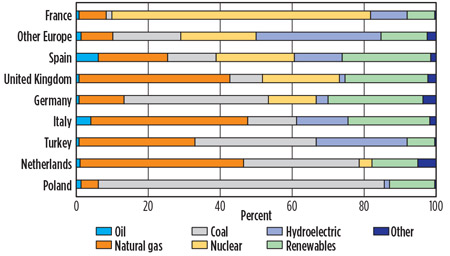
Fig. 1 shows large differences in power generation between countries. The region’s record on the use of renewables in power generation is impressive. At present, about 55% of Europe’s power comes from renewable sources, including nuclear.
 |
|
Fig. 1. European power generation by fuel type, 2017. |
The growth in wind and solar power is impressive, but with a dysfunctional system of carbon pricing, it has often displaced gas instead of coal. To imagine that renewable sources could replace the 75% of primary energy provided by fossil fuels in the short term is not credible. A pincer movement with gas is more likely, but the scale of the change would be gargantuan.
To give an idea of scale, to replace 50% of the coal used in power generation with gas would require an additional 33 Bsft3d (0.934 Bm3d) of gas—a doubling of current imports—or 250 metric MMtpy of LNG import, which equals the combined output of the world’s four largest producers. This will never be achieved, but that Europe will see a revolution in gas and LNG imports is inevitable.
The switch from coal to gas is forecast to be particularly strong in the European power sector, with the use of gas for power forecast to double on the year this summer, to 82 MMm3d (2.9 Bsft3d).1
Why is coal not dying?
Despite significant growth in the 1990s and early 2000s, gas is used for less than 20% of power generation—i.e., less than is generated by coal. When gas is traded in $/MMBtu and coal in $/metric t, it is hard to compare the two. When both are converted to $/MMBtu it can be seen that, in Europe, coal is half the price of natural gas and 40% that of imported LNG. Coal consumption in Europe will not fall significantly unless carbon prices rise or governments legislate.
On this second point, as the gilets jaunes movement has shown, governments that legislate energy price increases risk their jobs. In France, public opposition to a rise in carbon taxes, which was to coincide with a scheduled 25% increase in vehicle fuel tax prices, resulted in the French government canceling the fuel hikes at the end of 2018. The French government is examining ways to reintroduce the fuel taxes at a later date, but opposition from consumers remains strong.
Europe has the wrong energy in the wrong places. Two reasons exist for why natural gas is not more popular in Europe. Firstly, Europe does not have very much gas of its own. Secondly, the gas that exists is in the wrong places.
At current consumption levels, Europe has nearly 100 yr of coal reserves, but only 2 yr of oil and 6 yr of gas. The gas that Europe has is also far from its consumers. Over the next 20 yr, Europe’s domestic production is likely to be halved as output from the North Sea by Norway and the Netherlands dwindles. Norway will be unable to sustain its production after the mid-2020s due to a lack of new projects and discoveries.2
Fig. 2 shows that most countries are in net deficit of gas, and make up their deficits through imports. Only Norway has a surplus of gas, but this could change after 2025 if resource growth continues to slow and if the estimated undiscovered reserves in the Barents Sea are not exploited quickly. Note: Insufficient reserves replacement would also shackle Norway’s competition with Russia in the LNG market.
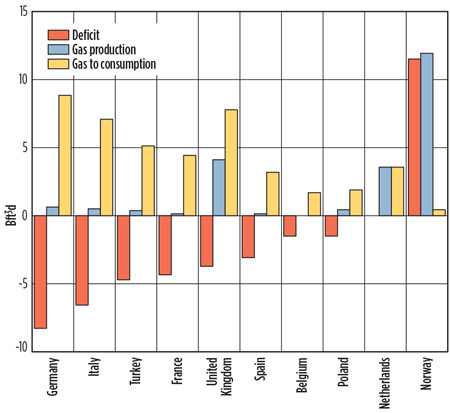 |
| Fig. 2. Gas deficits by country. |
The Netherlands, meanwhile, is in balance with gas for now, while all other countries are in deficit. Germany, Italy, France and Turkey import nearly all of their gas. Germany is also in the process of phasing out nuclear power from its energy mix by 2022, while France aims to reduce its nuclear power use by 75% of its domestic energy mix to 50%, meaning they will need more gas.
Gas imports come to Europe from three sources: intra-European transfers; LNG imports; or imports from non-EU countries, predominantly Russia. Of Europe’s total gas import volume, Russia supplies approximately 37% via pipeline; Norway contributes around 30% via pipeline from within the EU; and Algeria, Azerbaijan and Iran collectively represent about 25%. The gas flowing into Europe enables it to act as a “balancer” for global gas trade with its LNG trading hubs, spare import capacity, and trans-shipment and re-export capabilities.
Among Europe’s gas import sources, cross-border EU trade is unlikely to grow, as production and reserves are dwindling. Increased pipeline imports, from Russia and other non-EU sources, and LNG are the most viable areas of growth. An important question remains: How dependent on Russian imports would Europe like to be?
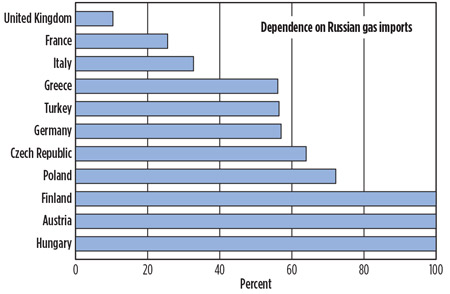
The “cliffhanger” of Nord Stream 2. Some countries are significantly more dependent on Russian gas imports than others (Fig. 3). The Economist has classified Nord Stream 2, the planned gas pipeline expansion from Russia to Germany, as an entirely political venture.3 Nord Stream 2 would allow Ukraine and Poland to be bypassed, increasing the countries’ dependence on Russia and boosting the total volume of gas on the Nord Stream network from 55 Bm3y (1,942 Bsft3y) to 110 Bm3y (3,884 Bsft3y). It is easy to understand the disparity of views on Nord Stream 2. The 1,200-km pipeline is set to bypass Ukraine and Poland, threatening the countries’ energy security to the benefit of Germany’s.
 |
|
Fig. 3. European dependence on Russian gas imports. |
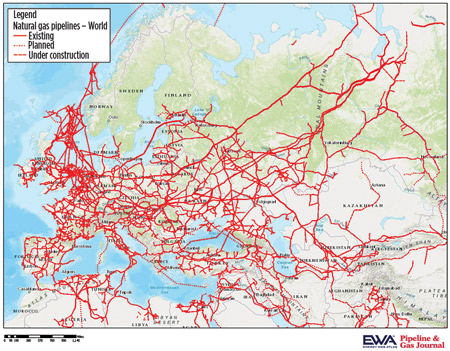
Existing pipelines from Russia via Ukraine have the capacity to meet Europe’s current and future needs (Fig. 4). As of March, Gazprom’s Nord Stream 2 plan has been upended by Denmark’s Energy Agency, which requested Gazprom to look into a more southerly route to pass through Danish waters. Although the pipeline is already supported by German, French, Austrian, Dutch and British companies, Danish approval is the last hurdle needed to finalize Gazprom’s construction permit for the pipeline. Additionally, a Swiss court has blocked Nord Stream 2 operators from making payments to Gazprom as part of an ongoing dispute between Gazprom and Ukraine’s Naftogaz.4
 |
|
Fig. 4. Europe’s dependence on Russian pipeline gas. |
Nord Stream 2 likely will not meet its scheduled startup of January 1, 2020. The setbacks could also cost years in negotiations and force Russia to begrudgingly renew its contract at year-end to send pipeline gas to the EU through Ukraine. If Russia chooses not to renew its contract with Ukraine, however, then Europe’s gas storage will need to be filled to maximum capacity ahead of the 2019/2020 winter, particularly if Nord Stream 2 is still embroiled in legal turmoil.
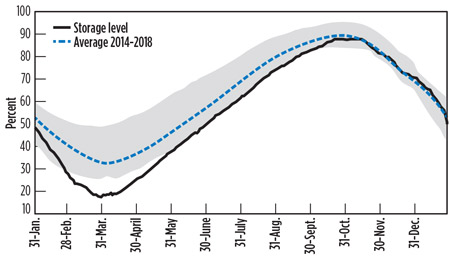
Spot purchases of LNG can help fill the gaps; however, at average or higher-than-average demand levels, Europe does not have the storage capacity to survive a winter without Russian gas exports (Fig. 5).5 Germany, France and Italy can stockpile only one third of their yearly gas demand. Ukraine has the largest gas storage facilities in Europe at 32 Bm3 (1,130 Bsft3), compared with the EU total of 146 Bm3 (5,155.2 Bsft3). To preserve its energy future, Europe must strike a balance between low-cost, high-risk Russian gas and higher-cost, low-risk LNG from the US, the Middle East and elsewhere.
 |
|
Fig. 5. At end-year 2018, European gas storage levels were near the 5-yr average, mainly due to sluggish demand at the start of the winter heating season. |
So where does gas fit in European energy?
Among this muddle of history and disparity of approach lies a quasi-certainty for gas and LNG: demand will grow significantly. There are two good reasons for this: Europe is running out of gas; and CO2 emissions, while falling, are not falling fast enough.
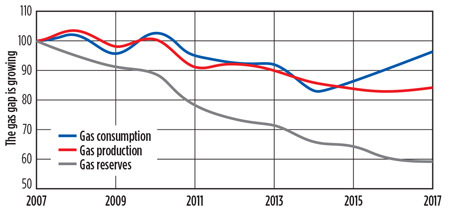
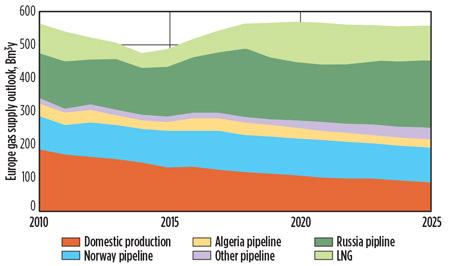
Mind the gap. Gas consumption is holding steady, but production is declining and the gap is growing (Fig. 6). Despite recent encouraging finds in the North Sea,6 reserves have fallen 40% in 10 yr. The gap between gas production and consumption is currently 28 Bsft3d (0.792 Bm3d), equivalent to the total LNG exports of Qatar and Australia combined. As production continues to fall, the gas gap will grow as first coal, and then oil, are displaced. But where will the gas come from? Europe’s growing need for gas imports (Fig. 7) can be satisfied by four scenarios, as outlined in the following sections.
 |
|
Fig. 6. The gap between gas production and consumption is growing. |
 |
|
Fig. 7. Outlook for European gas supply through 2025 (Source: Shell). |
The problematic promise of Russian gas. Russia has the world’s largest gas reserves. At current consumption levels, they are adequate to meet 100 yr of demand. Of Europe’s total gas supply, approximately 37% comes from Russia. If the Nord Stream 2 pipeline moves forward in a timely manner, it can easily compete with imported LNG. Gazprom will be able to supply gas to the German market at a cost of $4 MMBtu–$5/MMBtu. Few lower-cost options are likely to emerge, and none will be able to meet the volume requirements. However, Russia has been known to use gas supplies as a strategic weapon in the past and could do so again.3
As Fig. 3 shows, many of Europe’s countries are already highly dependent on Russia for their gas. At present, Gazprom pumps 190 Bm3y (6,709 Bsft3y) of gas to Europe through existing pipelines. To put this figure into perspective, Gazprom’s pipeline volumes are four times the current capacity of all US LNG export terminals combined.
Russia also has LNG. Russia is now also a large and fast-growing LNG player. Independent producer Novatek, quietly and without fanfare, has been changing the world of LNG. Yamal LNG surprised the industry by not only shipping its first cargo on time at the end of 2017, but by ramping up all three of its 5.5-metric-MMtpy trains to full capacity in the space of 12 mos. Additionally, the location of the Yamal fields makes it easy for Novatek to ship LNG west or east.
Novatek has announced plans to expand its capacity to 70 metric MMtpy—equivalent to Qatar’s current export capacity and 20% of the world’s current export capacity—by 2030. The company will achieve this with the addition of a fourth train at Yamal over the next few years, in addition to its planned Arctic LNG 2 venture, located on the Gydan Peninsula in Northern Siberia, across the Gulf of Ob from Yamal LNG. Arctic LNG 2 will bring online three LNG trains of 6.6 metric MMtpy each in 2022/2023, offering additional LNG supply from Russia.
Furthermore, Gazprom is planning to launch a third LNG train at its existing Sakhalin 2 LNG terminal in Russia’s Far East in 2021. If both Arctic LNG 2 and Sakhalin 2 reach a positive FID in 2019, then Russia’s LNG production capacity will expand by 25.2 metric MMtpy.
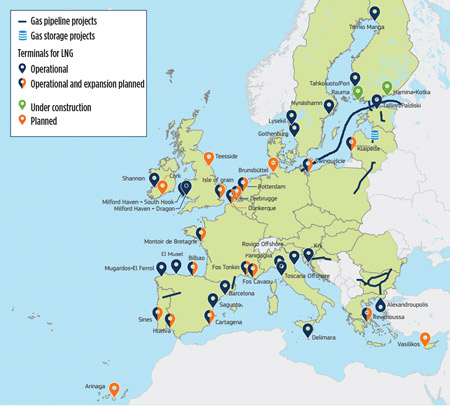
Europe is the local market for much of this LNG—particularly France, which has a 20% stake in Yamal. However, Novatek also has access to China and other Asian markets, for which Norway is competing in the LNG space. Europe has little choice but to increase LNG imports. A surge in new LNG import terminals, pipelines and storage capacity can be expected (Fig. 8), with many being FSRUs rather than onshore terminals.7
 |
|
Fig. 8. Ongoing and future gas pipeline, storage and LNG import terminal projects in Europe (Source: European Commission; edited to add Nord Stream 2). |
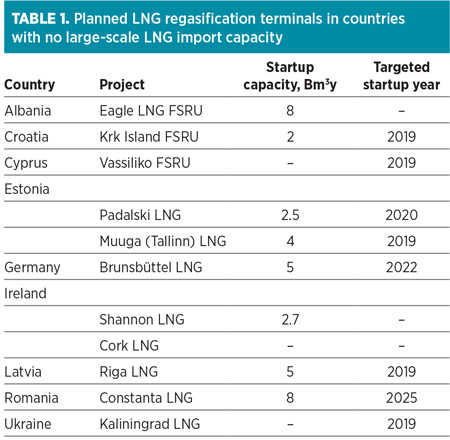
The region has 28 large-scale LNG import terminals (including four FSRUs) and eight small-scale LNG terminals in operation, with around 26% of total regasification capacity utilized. The EU is supporting 14 LNG infrastructure projects (including pipeline connections) that could collectively increase the bloc’s import capacity by 15 Bm3 of gas (529.65 Bsft3) by 2021, compared to Europe’s existing LNG import capacity of 210 Bm3 (7,415.1 Bsft3).8 Of note is that several terminals are planned for countries that do not already have a large-scale LNG terminal in place (Table 1).9
 |
New regasification capacity is a good medium-term strategy for Europe, but supply constraints remain over the near term. With Norway’s production level maxed out since 2010, constrained pipeline gas supplies from Algeria and Libya, and almost no new gas coming to Europe from Azerbaijan via the Southern Gas Corridor, it may seem that Russian gas is the most viable way to meet Europe’s demand. However, other options are available.
Uncle Sam to the rescue? With Henry Hub gas prices at around $3.5/MMBtu, plus $3/MMBtu to liquefy and $1/MMBtu to ship, LNG can be landed in Europe for about $8/MMBtu. Will this be attractive to Europeans? The answer is maybe not, or at least only for peakshaving, niche or strategic purposes. Gas on the UK National Balancing Point (NBP) trades above this point only in mid-winter.
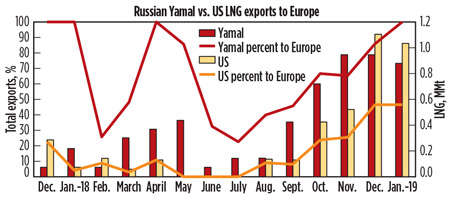
Cheap Yamal imports ruled Europe’s LNG import market in 1H 2018, but a fivefold increase was seen in US LNG exports to Europe over the winter of 2018/2019 (Fig. 9). The increase came about as prices for US exports to Asia fell sharply on lower-than-expected demand; those cargoes were then funneled to Europe (Fig. 10).
 |
|
Fig. 9. LNG exports to Europe from Novatek’s Yamal LNG vs. from US LNG terminals. |
 |
|
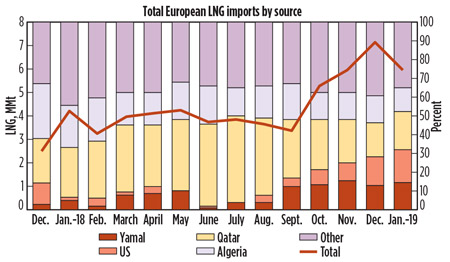
Fig. 10. Total European LNG imports by source, metric MMt. |
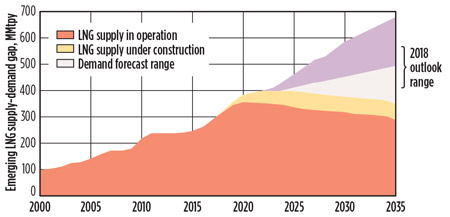
Although a temporary glut of LNG has emerged globally, pressuring down prices,10 this is expected to reverse around the middle of next decade as spare production capacity is limited by high CAPEX for new projects. Several frontrunners are scheduled to take FIDs this year. The LNG export industry must grow beyond that time, as evidenced by the forecast gap shown in Fig. 11. Note that this forecast supply-demand gap is dependent on global LNG consumption remaining steady or strengthening.
 |
|
Fig. 11. The world could see a growing gap of LNG supply approaching 2025 (Source: Shell) |
The US offers high-cost, low-risk LNG, but it will have to compete strategically with lower-cost, high-risk gas from Russia, as well as expanding LNG supply from Qatar and other suppliers, for Europe’s demand. By 2030, forecast supply growth from Russia (50 metric MMtpy), the US (50 metric MMtpy) and Qatar (40 metric MMtpy) could introduce an additional 140 metric MMtpy of LNG into the market. However, Europe has one remaining option for meeting its gas needs.
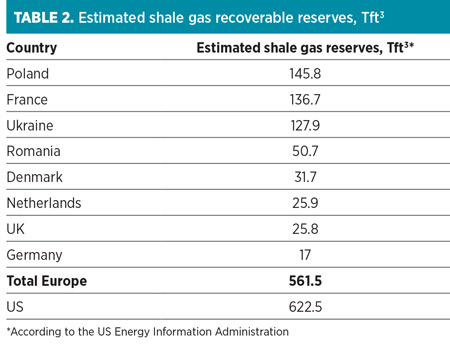
The shale question. A shale revolution of the type seen in the US will not happen in Europe, but a much quieter and smaller-scale adaptation could fit the bill if drilling restrictions are relaxed. The US Department of Energy11 estimates that Poland, France, Ukraine and others have large recoverable reserves, while the UK, Netherlands and Germany have smaller reserves. To put the figures in Table 2 into perspective, they equate to five times Europe’s current proven gas reserves and are not far from the estimated reserves volume of major shale producer the US.
 |
Yet, fracing has been banned in France, the Netherlands, Luxembourg, the Czech Republic and Bulgaria, and stopped in Germany. The UK has limited the maximum amplitude of seismic activity as a result of fracing to Richter level 0.5, which is 3,000 times less the limit imposed in the US. The southeast of the UK regularly sees shocks at Richter value 3 without harm or damage.
Producers Cuadrilla and INEOS are awaiting relaxation on tremor regulations to continue exploiting shale gas reserves in northern England. Meanwhile, IGas has announced a shale gas discovery in the central part of the country amounting to 37 Tm3 (1,306.47 Tsft3).
Aside from environmental concerns, high drilling and production costs are a major limiting factor in the exploitation of Europe’s shale reserves. Shale gas production costs in Europe are likely to remain at least 60% higher than US production costs, until understanding of the geology improves. New drilling and extraction technology developments may, in the future, help develop shale formations in Europe at lower cost.
Without drilling appraisal wells, which require fracing, the figures in Table 2 are far from bankable. However, they are sufficiently large, and the alternatives sufficiently risky, to justify further work.
Where does this take us?
Europe has three options for increasing its gas supply: continued reliance on Russian gas; greater imports of LNG from Russia, the US, Qatar and elsewhere; and its own shale reserves. A combination of the first two options is most likely.
Fluctuations in supply attractiveness (for political and price reasons) and availability could be seen, as new LNG projects are either stalled or fast-tracked, amid the ongoing debate over Nord Stream 2. The combination of growing supply potential and geoplitical uncertainty in energy dominance makes for a riveting debate on Europe’s natural gas future. However, it is only one part of the equation. The EU’s signature of the Paris Agreement, and its intended adherence to its emissions targets, have vast implications for Europe’s energy mix.
The events of COP 21 in Paris in late 2015 are significant. One hundred and ninety-seven countries agreed to reduce their total carbon emissions to achieve a maximum global temperature rise of 2°C and make every effort to limit the rise to 1.5°C. The agreed goal was for greenhouse gas emissions to peak as soon as possible, and to achieve net zero emissions in the second half of this century. Can this be achieved? Likely not, but the target should not be ignored.
Pierre Friedlingstein, a climatologist at Exeter University, calculates that to achieve the 2°C target, the world can emit about 3,200 gigatonnes of carbon dioxide in total. The tally so far is 2,000 gigatonnes. If annual emissions remain at 2015 levels, then the budget will be exhausted in just 30 yr.12
As Fig. 12 shows, globally, emissions are not remaining at 2015 levels; they are rising. Last year, carbon emissions from fossil fuels hit a record high worldwide of 37.1 metric Bt. Over the last 10 yr, only Europe and North America have reduced their CO2 emissions. North America has mitigated its emissions through shale gas production, which has, through commercial drive, displaced coal; Europe has done it through the heavy subsidy of wind and solar power, which have also displaced gas. Each will benefit the other. Low gas prices in North America will spur European LNG imports and give Europe an alternative to Russian gas imports. The springboard that the EU has given to renewable energy means that it can now look after itself.
 |
|
Fig. 12. CO2 emissions are rising worldwide. |
Fig. 12 reveals two self-evident truths:
- The targets of the Paris Agreement will not be met by all signatories
- However fast the growth of solar and wind power, fossil fuels are here for some time, and gas will be increasingly needed.
Part 2 of the equation: Europe’s climate commitments
Add to the need for more and varied energy imports the EU’s promise to reduce greenhouse gas emissions under the Paris Agreement, and the complexities of Europe’s “insoluble energy equation” begin to emerge.
The EU is a single common signatory to the Paris Agreement on Climate Change and is legislated to reduce its CO2 emissions. The EU’s nationally determined contribution (NDC) under the Paris Agreement is to reduce greenhouse gas emissions by at least 20% by 2020 compared to 1990 levels, and by at least 40% by 2030.
The EC’s 2030 Energy Strategy names targets for renewable energy use (32%, revised upward last year from 27%) and increases in energy efficiency (32.5%, revised upward from 30%). If these agreed EU-level policies are fully implemented, then EU emissions could be cut by as much as 45% by 2030, according to the EC. This is unlikely to happen, however, according to data from the European Environment Agency (EEA) (Fig. 13).13
 |
|
Fig. 13. The EU will miss its 2030 emissions targets. |
Total greenhouse gas emissions from EU members are expected to decrease by 26% from 1990 levels by 2020, surpassing the 2020 target. This is good news. However, only a 32% reduction in emissions can be achieved by 2030, which falls well short of the 40% base target, according to the EEA.
Ahead of COP 24 in December 2018, the Grantham Research Institute on Climate Change and the Environment, in collaboration with the World Resources Institute, released a study14 finding that only 16 of the 197 countries signed to the Paris Agreement have defined climate plans ambitious enough under their current NDCs to meet their emissions reduction targets for 2030.
According to the study, a significant gap exists between projected emissions in 2030 and emissions reductions that are compatible with the goals of the Paris Agreement. Existing NDCs are collectively consistent with global warming in the range of 2.7°C–3.7°C. The gap for limiting the global temperature increase to 2°C is 11–13.5 gigatonnes of CO2, while the gap for limiting global warming to 1.5°C is even higher.
From 2014–2018, EU emissions decreased by 3%. Most of the reductions have taken place in the energy supply sector, where an 11% drop was seen. However, emissions from transport, agriculture and international aviation have increased over the last 4 yr. Transport emissions have increased by 7%, or 60 metric MMt, as compared to 2013, mainly due to growing emissions from road transport. Emissions from industrial processes have varied from year to year, showing no clear trend.15 The historical dysfunction of the EU’s Emissions Trading System (ETS) has contributed to the lack of clarity and drive for emissions reductions.
Emissions trading uncertainty. The EU ETS, which came into force in 2005, is the foundation of EU policy on mitigating climate change by cost-effectively reducing greenhouse gas emissions. It is the first multinational cap-and-trade system implemented at the facility level and covers 45% of EU CO2 emissions at nearly 13,000 installations. The 31 countries (i.e., all 28 EU countries plus Iceland, Liechtenstein and Norway) that participate in the ETS account for 20% of global GDP.
The main goal of the EU ETS is to help EU members meet their commitments under the Kyoto Protocol to limit or reduce greenhouse gas emissions in a cost-effective way. The ETS does this by limiting the overall level of emissions across EU nations and permitting the trade of emissions allowances. Each allowance gives the emitter the right to emit 1 metric t of CO2.
The ETS has suffered problems since its startup in 2005. Its emissions caps are too high, international credits have been used extensively, and economic downturns have been largely responsible for the production and emissions reductions charted by the system. As a result, a large number of surplus allowances have accumulated since 2008, weakening the system. So far, the ETS has not succeeded in making electricity generation from high-polluting sources like coal more expensive, or spurring low-carbon investment and technology advances in the industry sector.
According to data released by the EC on April 1, CO2 emissions regulated by the ETS fell an indicative 4% (70 metric MMt) in 2018, led by reductions in the power generation sector and helped by slower-than-expected growth in industrial production. However, emissions from the 10 largest plants participating in the ETS—mostly lignite-fueled power plants in Germany and Poland—dropped by only 0.6%.
To combat the flagging ETS system, EU legislators have pushed through a number of reforms over the past 3 yr. These reforms include a market stability reserve to remove 1.7 metric Bt of emissions allowances from the market. The market stability reserve, which became operational on 1 January of this year, aims to make the scheme more resilient to imbalances in the supply and demand of allowances.
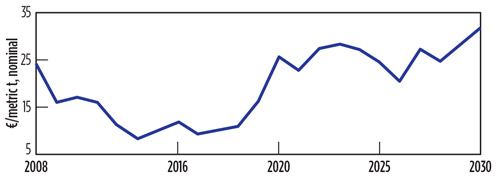
Although the CO2 price had been hovering at around €7/metric t for several years, it rose sharply in 2017/2018 and is anticipated to increase further (Fig. 14). This provides more incentive to push coal off the power grid.
 |
|
Fig. 14. CO2 prices could trend higher on ETS reform. |
In an alternative scenario, however, the surplus of CO2 allowances could grow through 2030, despite the recent ETS reforms. Economic growth has the highest bearing on the health of the ETS system; therefore, sluggish growth would have a significant negative impact on ETS trading. Another potential problem is the “waterbed effect,” wherein national legislation to cut emissions from the power sector simply results in allowances being transferred between emissions cutters in one country and allowance buyers in another. Also, a no-deal Brexit would unleash a flood of unneeded CO2 allowances on the market. Any of these scenarios would weigh on CO2 prices and stall the recent progress made by the ETS.
The takeaway from all this is that Paris Agreement signatories are floundering in their commitments, the EU included. The ETS could easily be knocked down again, after recently struggling to its feet. Cleaner energy in the form of gas and renewables, along with more aggressive reductions in coal use, will be needed to get emissions reductions back on track and prevent a catastrophic rise in global temperature of above 2°C.
Gas as a supplement to renewable energy
Some European nations are rich in hydrocarbon and renewable energy reserves, while others have few. At one end of the spectrum, France produces 90% of its electricity from renewable sources (including nuclear); at the other, Poland produces less than 15% from renewables. The Netherlands, home of the windmill, generates 40% of its power from gas but still relies heavily on coal.
Gas is an important backup for solar and wind power, as the sun does not always shine and the wind does not always blow. Furthermore, LNG-powered ships could assist in Europe’s fight against climate change, as LNG produces up to 80% less emissions than fuel oil. In the EU, €135 MM have already been invested in LNG maritime projects under the Motorways of the Sea initiative.
However, renewable power generation is displacing both gas and coal in Europe. Last year, renewable energy made up 37% of Germany’s power demand, overtaking coal for the first time. Renewables accounted for 35% of the UK’s power generation, with coal falling to a low of 5%. Overall, Europe’s primary coal demand slid 2.6% in 2018. Gas use for power generation also decreased last year, although this was partly due to lower heating demand.
Recent studies suggest that biomethane and hydrogen use will play larger—and cheaper—roles than previously expected in Europe’s energy use through 2050, particularly for heating and electricity. Furthermore, the electrification of transportation (and possibly heating) could result in an 85% increase in power demand across the region through 2040, by which time renewables could satisfy more than 60% of Europe’s total power supply.16
How will Europe balance its gas equation?
While dwindling, the age of coal is not yet over in Europe with some countries, notably Germany and Poland, facing large socioeconomic challenges. As yet, renewables and gas have had little impact on the transport sector. Oil is here for decades, albeit in reducing quantities. The near-term future will see growth in two energy sources: gas and renewable energy.
While the use of renewables in power generation has grown significantly, it is from a small base. That renewables can displace all fossil fuels within 40 yr is inconceivable. For the time being, gas and renewable energy will work in a pincer movement to displace first coal in power generation, and then oil in transport.
Europe’s gas will arrive by pipeline, often from Russia; it will also arrive by ship. Perhaps Europe will also wake up to recognize the large volumes of shale gas under its feet. New drilling and extraction technology developments may help develop shale formations in Europe at lower cost in the future.
Uncertainty of supply from Russia is perhaps the key variable in Europe’s gas equation over the short term. Large growth is needed in LNG regasification facilities to counter the risk of Russian dependency. Investment in the construction of new regasification terminals and LNG bunkering facilities presents a major opportunity for Europe’s supply chain of contractors, consultants, technology and equipment suppliers.
The world’s politicians have met every year for 25 yr; they have made agreements, issued communiques, set targets and consistently failed—although the EU less than any. The solutions to climate change do not rest with politicians, but with engineers and scientists. They must educate politicians, and work to develop and commercialize the next generation of low-carbon technologies.
The change will be led by Europe’s integrated energy companies. They are not the problem, as perceived by some, but rather the solution. Total, Shell and BP are already taking large strides. They need the help of the best engineers and scientists. What do they offer in return? Quite simply, the greatest of challenges and the greatest of opportunities: The opportunity to save the planet. GP
NOTE
This paper was presented at the GPA Europe Spring Conference in May 2019 Amsterdam, the Netherlands.
LITERATURE CITED
- “Natural gas glut weighs on European energy Q2 outlook,” Platts, 29 March 2019.
- Parskova, T., “Norway’s oil production to fall to 30-year low,” Oilprice.com, 12 January 2019.
- “The Nord Stream 2 gas pipeline moves on,” The Economist, 16 February 2019.
- “Russia, Ukraine and gas: Pipe down—The annual gas squabble between Russia and Ukraine turns nastier—to the alarm of much of Europe,” The Economist, January 2009.
- Reierson, A., R. Landberg and V. Dezem, “Warmer shift in Europe brings mixes for gas and power traders,” Bloomberg, 3 February 2019.
- “Total and CNOOC make biggest UK offshore gas discovery in 10 years,” Financial Times, 29 January 2019.
- Songhurst, B., “The outlook for floating storage and regasification units (FSRUs),” The Oxford Institute of Energy Studies, July 2017.
- Vugmanovic, O. and S. Zawadski, “Trump bets on new European LNG terminals but EU funds meager,” Reuters, 31 July 2018.
- “LNG in Europe in 2018: An overview of LNG import terminals in Europe,” King & Spalding, July 2018.
- Terazono, E., D. Sheppard and N. Thomas, “Gas supply glut in Europe drives prices to multiyear lows,” Financial Times, 3 April 2019.
- US EIA, “World shale gas reserves,” 24 September 2015, online: www.eia.gov/analysis/studies/worldshalegas/
- “Hot and bothered—Special report on climate change,” The Economist, 28 November 2015.
- “Total greenhouse gas emission trends and projections,” European Environment Agency, 19 December 2018.
- “Aligning national and international climate targets,” Grantham Research Institute on Climate Change and the Environment, and the World Resources Institute, October 2018.
- European Commission, “EU on track to implement Paris commitments, Member States preparing 2030 energy and climate plans,” 26 October 2018.
- Blackaby, N., “Electrification and renewables boom across Europe will require huge grid resilience,” Power Engineering International, 19 March 2019.
 |
Adrienne Blume is Editor of Gas Processing & LNG and Executive Editor of Hydrocarbon Processing at Gulf Energy Information in Houston, Texas. She has more than 15 yr of experience in energy media. She speaks and moderates at energy conferences and events around the world and is published in several industry journals. She also sits on the advisory board of GasPro, an annual technology-focused event held in Houston, and provides key support for the Eastern Mediterranean Gas Conference (Cyprus) and Women’s Global Leadership in Energy Conference (Houston and Vienna). Ms. Blume holds an MA degree in English and Publishing from Rosemont College in Rosemont, Pennsylvania, as well as BA degrees in English and Anthropology from Webster University in St. Louis, Missouri.
 |
Malcolm Harrison, a retired chemical engineer, in 2014 set up Harisiti Ltd., a company that trains and coaches people who have recently joined the energy industry. He is also a PetroSkills/John M. Campbell Instructor and delivers the flagship “gas conditioning and processing” course. Mr. Harrison also manages the affairs of GPA Europe Ltd. He worked for BP, BOC, Foster Wheeler and the BG Group, with experience spanning research to building large energy, refining and petrochemical projects. He holds a first-class BEng degree from the University of Bradford and an MBA degree from Kingston Business School.


Comments