
Optimal control of mixed refrigerant composition at Sakhalin LNG plant
A technique for the optimization of mixed refrigerant (MR) composition was developed and successfully applied at the Sakhalin LNG plant on Sakhalin Island, Russia. Indirect control of the MR composition was implemented via calculated inventories, replacing direct control of component concentrations and maximizing the LNG plant’s performance.
Introduction. The MR cycle is used for liquefaction and subcooling of natural gas in most large LNG trains based on technologies such as AP-C3MR, AP-X and Shell DMR. The varying composition of MR cycle technology is its major advantage over the Cascade process. This advantage comes from the fact that MR composition can be adjusted to fit the natural gas condensation curve and maintain an optimum temperature approach between cold and warm streams inside the main cryogenic heat exchanger (MCHE) for a wide range of NG inlet temperatures, depending on propane or precooling MR (PMR) cycle duty. Additional degrees of freedom related to MR composition help increase the efficiency of the refrigerant cycle. The correct setup of MR composition setpoints, as well as their robust control, are key problems that must be solved to maximize the efficiency of any MR cycle.
The MR composition optimization and process control solutions described in this article were developed and implemented in-house at the Sakhalin LNG plant operated by Sakhalin Energy Investment Co. Ltd. The research results were successfully applied on the MR circuit of the Shell DMR process, but they are generally valid for any MR cycle, irrespective of specific LNG technology details. The results are summarized in the following points:
- The Carnot factor was used as an invariant parameter to assess refrigeration cycle performance. The invariance is a crucial feature of the factor that enables the comparison of cycle performances in different plant operation cases.
- Clear correlations were observed between the Carnot factor and the MCHE temperature approaches, as well as between the temperature approaches and the concentrations of MR components. From these correlations, functions of optimal MR composition setpoints were derived and implemented in the plant’s control system.
- To maximize control effectiveness, a new MR composition control strategy was applied. It is based on calculated component inventories rather than on component concentrations. This transformation effectively linearizes and decouples the system of controlled variables, contributing to higher control performance and, thereby, more efficient plant operation.
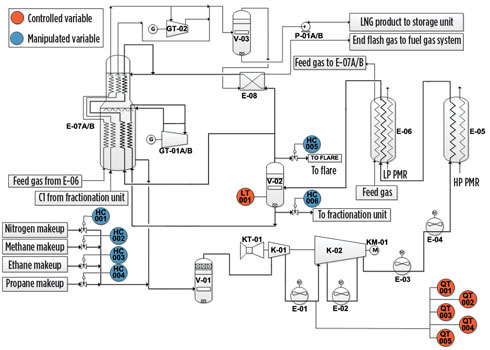
Process description. The Shell DMR process applied at the Sakhalin LNG plant uses a PMR cycle and an MR cycle to liquefy natural gas.1 The MR cooling cycle—in which the refrigerant is a mixture of nitrogen, methane, ethane, propane and traces of butane—provides the cooling duty for the liquefaction of gas within a temperature range of –40°C to –150°C (Fig. 1).
 |
|
FIG. 1. MR cycle of Shell double mixed refrigerant process. |
MR vapor exiting the shell side of the MCHE’s E-07A/B section is compressed in MR compressors K-01 and K-02. Intercooling and initial discharge cooling are achieved by air coolers E-01, E-02, E-03 and E-04, while further cooling and partial condensation are achieved by cooling against PMR at two different pressure levels—the E-05 high-pressure PMR precooler and the E-06 low-pressure PMR precooler. Cooled and partially condensed MR is separated into light mixed refrigerant (LMR) vapor and heavy mixed refrigerant (HMR) liquid in MR separator vessel V-02. The HMR and LMR high-pressure streams are subcooled separately inside the MCHE and returned to the shell side after expansion, providing cooling duty for gas liquefaction.
The separation of MR in V-02 creates two cycles with different compositions and circulation rates. The composition of refrigerant in different sections of the MR cycle is far from uniform, which is a challenge for tight control.
Changing process conditions for two-phase MR mixture flashing in V-02 are the main source of variability in MR composition measurements. The flashing is defined by three parameters:
- The MR temperature in the E-06 outlet, which depends on PMR cooling duty
- The LMR to HMR mass ratio (LMR/HMR), which is maintained by the control system
- The MR composition, which depends on the V-02 separation temperature and LMR/HMR, as well as on component inventories in the MR system.
The pressure in V-02 results from vapor-liquid equilibrium. A two-phase mixture with a given composition at a given temperature splits the vapor and liquid phases with a given ratio between them, but only at a certain pressure. In this system of mutually dependent parameters, the MR component concentrations are subject to the influence of many factors, and the component inventories are the only invariants. In general, the inventory of an MR component in the system can be changed in a controlled way by adding a certain component and removing either the HMR mixture or the LMR mixture. Changes in pressure and temperature in different parts of the MR circuit affect the MR holdup in those parts, while the total inventory is fixed and the HMR liquid level in V-02 serves as a buffer for those fluctuations.
Optimization of MR composition setpoints. Most MR composition optimization techniques deal with an offline process model, rather than with a running plant.2,3 Usually, such techniques represent a combination of a relatively simple model of a liquefaction unit and a fully or partially automated optimization routine.
However, at Sakhalin LNG, this method was found not to work well for the optimization of a running plant. Any mismatch between process equipment models and actual plant operation resulted in a sub-optimal solution where the actual plant performance did not reach the predicted level, or even decreased. The adoption of a rigorous, model-based MR optimization of a running LNG plant has potential, but this depends on the further development of modeling techniques.
Statistical treatment of past operational data is the most prevailing method adopted by the LNG industry for the optimization of MR composition at running plants. It provides credible results if the data population is large enough to represent the variations of MR composition and cycle efficiency. The method is based on the extraction of top efficiency data from the total data population, as well as the development of correlations between PMR or propane cycle cooling temperature and optimum MR component concentrations. The main challenge of this method is deriving an invariant performance indicator that is sufficient to describe cycle efficiency. The estimation and application of the Carnot factor for MR composition optimization at Sakhalin LNG is described in the following paragraphs.
If PMR cycle capacity is given and fixed, the total flowrate of LNG measured just downstream of the MCHE’s E-07A/B unit depends on several factors:
- Gas temperature on the E-07A/B inlet (i.e., cutpoint temperature, or Tcp) as defined by PMR cycle operating conditions
- LNG temperature on the E-07A/B outlet (i.e., LNG rundown temperature, or Trd) as defined by the control system
- The available power of MR compressor drivers (KT-01 and KM-01)
- MR cycle coefficient of performance, which is the ratio of cooling duty provided to the gas stream over the compressor drivers’ total power. It can vary depending on MR cycle process conditions, as well as on equipment availability.
The actual performance coefficient of the MR cycle can be calculated as shown in Eq. 1:
![]() (1)
(1)
where:
FLNG = LNG flowrate
∆HLNG = NG enthalpy change over the temperature range from Tcp to Trd
PMR = Power of MR drivers delivered to MR compressors.
The MR cycle coefficient of performance is a value invariant to the changes of available power, since the LNG production rate is a function of the power (1). The ratio of actual COP to ideal COP (Carnot factor) was used to obtain a value that is also invariant to Tcp and Trd, as shown in Eq. 2:
 (2)
(2)
where:
Wid = Minimum specific work/1 kg of gas required to cool it from Tcp to Trd in an ideal refrigeration cycle.
 |
 |
|
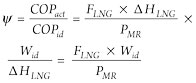
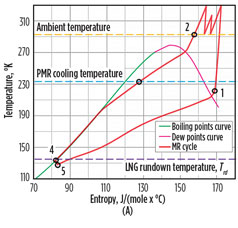
FIG. 2. Real (A) and ideal (B) refrigeration cycle diagrams showing compression withinter-cooling and after-cooling in air coolers (points 1–2); MR cooling in the PMR cycle (points 2–3); MR self-cooling in the MCHE (points 3–4); Joule–Thomson expansion (points 4–5); and MR boiling in the MCHE (points 5–1). |
The ideal cycle can be represented as the number of Carnot cycles, each operating between a specific cold reservoir temperature (gas condensation curve) and a hot reservoir temperature, which is common for all the cyclesTwo assumptions were made when defining an ideal refrigeration cycle for gas liquefaction (Fig. 2):
- The ideal cycle can be represented as the number of Carnot cycles, each operating between a specific cold reservoir temperature (gas condensation curve) and a hot reservoir temperature, which is common for all the cycles
- The hot reservoir temperature and the gas inlet temperature are the same.
The minimum specific work of the ideal cycle can be derived from the basic principles of the Carnot cycle3 (Eqs. 3,
4 and 5):
dwid = dqPMR − dqNG (3)
dqPMR = Tcp × dS (4)
dqNG = T × dS (5)
where:
NG = Natural gas
dqNG, dqPMR = Amount of heat removed from the gas stream and transferred to a high-temperature reservoir (PMR cycle)
dS = Entropy change corresponding to dqNG heat removed from the gas stream at absolute temperature T.
Combining Eqs. 3, 4 and 5, Eq. 6 can be obtained in differential form for ideal specific work:
 (6)
(6)
Condensation heat removed from the gas can be obtained in numeric form from a thermodynamic package and then converted into an analytical form as a function of temperature (Eq. 7):
dqNG = λ(T) × dT (7)
where:
λ(T) = Natural gas specific heat function of absolute temperature.
Finally, after integration of Eq. 6, minimum specific work Wid can be expressed as a function of Tcp and Trd and then used for Carnot factor estimation (Eq. 2), as shown in Eq. 8:
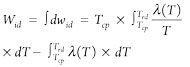 (8)
(8)
A major advantage of the Carnot factor is its invariance, which allows for the comparison of MR cycle performance based on a single scale, irrespective of the PMR cycle capacity, the available power of MR compressor drivers and variations in LNG rundown temperature. Therefore, the yearly probability distribution of the Carnot factor can help estimate the available room for cycle efficiency increases, as well as confirm positive effects after the implementation of optimization-related changes. Several operations were performed on historical operation data, including Carnot factor values array:
- Instrumentation bad data and periods of turndown or transient operation were filtered out, along with equipment unavailability and malfunctions
- Carnot factor inaccuracies due to instrumentation noise, as well as natural variance from suboptimal plant operation, were estimated
- The maximum possible increase in MR cycle efficiency was estimated
- Data was checked for correlation between several process parameters and the Carnot factor
- Functions of optimal MR composition setpoints were derived based on top-performance operational data
- Derived optimum functions were validated by applying them to all data populations and estimating an expected economic impact.
The list of process parameters checked for correlation with the Carnot factor included the MCHE’s superheat margins and temperature approaches, the MR compressor pressure ratio, the LMR/HMR mass flow ratio, the LMR and HMR compositions, the MR component concentrations and inventories.
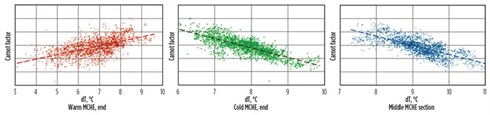 |
|
FIG. 3. Correlations between the Carnot factor of the MR cycle and the MCHE temperature approaches (Tcp slice from –47ÅãC to –48ÅãC). |
Clear correlations were found only between the MCHE temperature approaches and the Carnot factor, and between the MR component concentrations and the MCHE temperature approaches. This observation is important, since it confirms the theoretical conclusion that MR cycle efficiency strongly depends on MCHE temperature approaches (Fig. 3). At the same time, real plant data indicate that the minimum possible temperature approach does not correspond to the highest efficiency, likely because of limited heat transfer area and developing temperature pinch. Moreover, it was found that MR component inventories do not correlate with the cycle efficiency. This is the reason why the inventories cannot be used in an MR composition control strategy as self-sufficient optimization targets. In other words, a wide range of component concentrations (including optimum and sub-optimum sets) can correspond to a single set of component inventories.
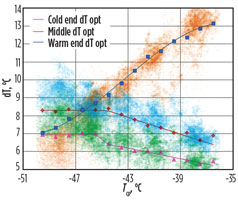 |
|
FIG. 4. MCHE temperature approaches corresponding to top 15% efficient operation vs. historical operation data variance. |
Operational data was sliced by Tcp values with a 1°C interval, and the slices were treated to extract cases with a high Carnot factor (top 15%) with corresponding MCHE temperature approaches. The average values of extracted temperature approaches were used to derive optimal ΔT functions (Fig. 4). Finally, the functions of optimum temperature approaches were used to extract the corresponding MR component concentrations data and build correlations between Tcpand optimum MR composition (Fig. 5). Those correlations could then be used for continuous scheduling of MR composition setpoints in a control system.
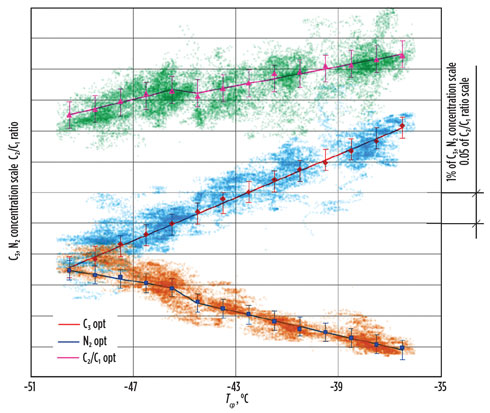 |
|
FIG. 5. MR composition corresponding to the optimum MCHE temperature approaches (error bars correspond to standard deviations of the correlations) vs. historical operation data variance. |
Indirect MR composition control via component inventories. Statistical treatment of operational data and MR cycle efficiency provides valuable information about minimum MR composition control compliance required to achieve the expected increase in performance. Standard deviations of MR component concentrations corresponding to the top-performance operation from the derived functions of MR optimum composition were used as control compliance benchmarks (see error bars on the trends in Fig. 5). This makes sense, since composition control tightness must be at least as good as the correlations between MR composition and cycle efficiency. Maintaining MR component concentrations within a ±0.3% target window is a challenge, since measured MR composition continuously experiences disturbance effects from several factors:
- Adjustment of LMR/HMR by control system
- Variation of PMR capacity resulting in Tcp changes
- Adjustment of MR compressor suction pressure by control system
- Variation of MR circulation rate
- Possible MR composition drift due to passing valves and leaking MCHE tubes.
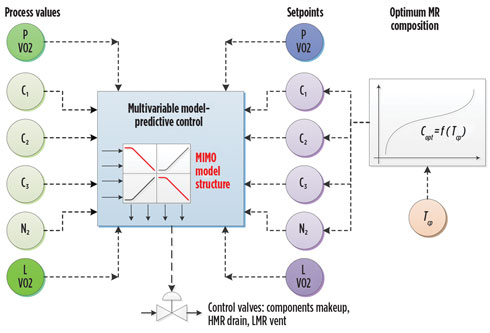
The most straightforward method of MR composition control relies on the direct use of component concentrations in the control scheme (Fig. 6). The V-02 level and pressure protective controls must be involved in that scheme, since the level does not depend on concentrations but rather on a measure of component inventories and must be controlled separately. At the same time, variations in the pressure allowed by that control scheme must be moderated by protective control.
 |
|
FIG. 6. Schematics of MR direct concentrations control. |
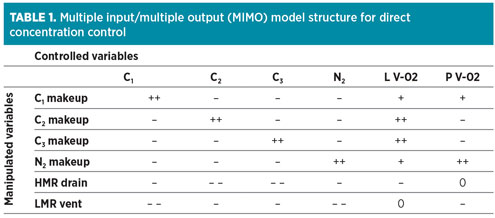 |
A general analysis indicates that no controllability issues are anticipated, since the numbers of controlled and manipulated variables are equal and each component is independently controlled (Table 1). However, several crucial features still limit the control performance of this scheme:
- The ramp character of process models between all manipulated and controlled variables
- Strong mutual dependency of the controlled variables
- Non-linear gains, depending on LMR and HMR composition
- N-1 degrees of freedom in the system of N component concentrations, which make independent control impossible.
The combination of listed features makes tight control impossible with the described scheme.
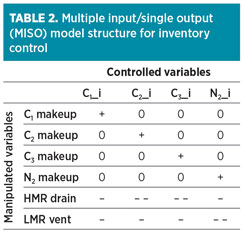
From a process control point of view, the inventory of each component is more suitable for control than its concentration in the MR mixture. The inventories are invariant to process changes (Tcp, LMR/HMR, etc.) and completely decoupled from one another, which simplifies the model structure from multiple input/multiple output (MIMO) to multiple input/single output (MISO) (Table 2).
 |
The transformation of actual and target MR component concentrations into actual and target inventories involves the input of V-02 level measurement and the level setpoint. It results in the indirect control of not only MR composition, but also the V-02 level. V-02 temperature changes are realized in smaller variances in V-02 pressure, due to the higher performance of the inventory control scheme; therefore, the use of a V-02 pressure protective control loop can be avoided.
 |
|
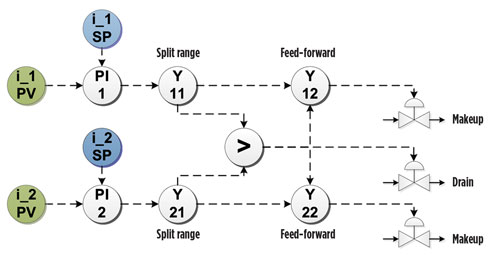
FIG. 7. Simplified example of base-layer inventory control scheme for a two-component system. |
While refrigerant composition control is traditionally implemented with the use of multivariable predictive control techniques, the decoupling of the controlled variables provides more freedom in the selection of control technology. An example of a simplified control scheme for the two-component system is shown in Fig. 7.
While pressure and temperature conditions and volumes are known for most of the MR circuit sections, the continuous online estimation of component inventories accumulated in the refrigerant loop is still not a straightforward operation (Eq. 9). Complexity comes from the non-uniform refrigerant composition across the circuit (varying gas compressibility and liquid density), as well as the presence of two-phase mixtures in some sections of the MR circuit.
![]() (9)
(9)
where:
nj = Amount of substance of j component in mixture
R = Universal gas constant
= j component concentration in i section of MR system
Pi, Ti = Pressure and temperature in the i section
Vi = Volume holdup of the i section
Zi = Compressibility of real gas in the i section.
A common solution for the outlined problems is to use the equation of state (EOS) solver for the continuous estimation of gas, liquid or two-phase mixture properties in all MR cycle sections. This approach was successfully applied at the Sakhalin LNG plant to estimate MR component inventories corresponding to actual and target concentrations.
The Peng-Robinson EOS solving algorithm4 was implemented at the distributed control system (DCS) as a structured text program developed in-house. It is robust against abnormal process conditions, like quick changes of parameters or trips, as well as instrument signal abnormalities.
 |
|
FIG. 8. Schematics of MR inventory control. |
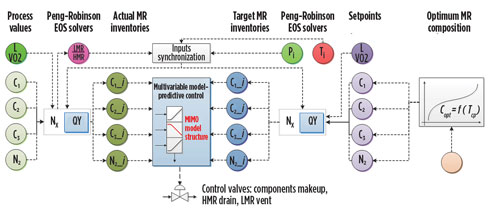
Several estimators were implemented for different sections of the MR circuit, linked with corresponding inventory calculations based on volume holdups of equipment and pipelines. The calculations provided estimates of actual and target inventories across the MR circuit, which are used for control (Fig. 8).
 |
|
FIG. 9. Calculation schematics for gas-liquid equilibrium in V-02 for actual and target MR concentrations. |
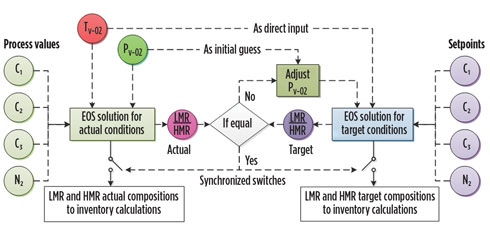
V-02 temperature is assumed to be the same for the actual and target conditions, since the temperature is an external parameter depending only on the PMR cycle cooling capacity. Pressure and flash rate, in combination with temperature and mixture composition, completely define two-phase equilibrium. In the inventory control of MR separation, flash rate is a fixed variable since it is directly related to the controlled LMR/HMR; therefore, the calculation of EOS for target conditions is supplied with an LMR/HMR target value that matches the operating conditions, and the pressure is adjusted to match the ratio. Note: The calculation of gas-liquid equilibrium in the V-02 vessel must be time-synchronized for actual and target MR compositions, as shown in Fig. 9. This ensures that calculation outputs will be delivered to inventory estimates at the same time and will correspond to the same process parameters. This point is crucial for minimizing the effect of measurement noise on parallel actual and target inventory estimates.
The implementation of MR inventory control has delivered excellent results in terms of MR composition compliance with optimum targets. An analysis of one month of post-commissioning operational data showed that MR composition had been maintained inside the specified target windows for approximately 98.5% of controller uptime, while the windows were specified at ±0.3 mol%, on average (the correlation error bars in Fig. 5 refer to the specified target windows).
 |
|
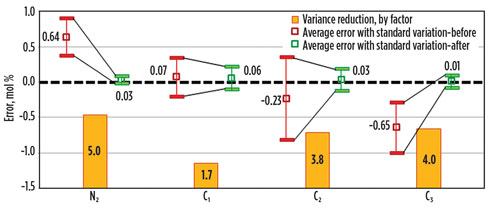
FIG. 10. MR composition offset and variation before and after the implementation of an inventory control scheme based on plant operational data. |
The average offset between MR component concentrations and dynamically set targets was reduced to zero, and the variance of the error was decreased by several times (Fig. 10). The inventory control scheme was also found to be sufficiently robust to work autonomously, without any adjustments by the control room operator, as opposed to the previously used direct-concentration control scheme that required 8–10 manual operator actions per day. These results show that inventory control is the correct strategy for improving MR composition control, resulting in increased LNG plant efficiency.
The methods of MR composition optimization and control described here have been patented in Russia (RU 2640976 C1). Similar patent applications have been submitted in six other countries (Australia, Indonesia, Malaysia, Nigeria, Qatar and the US) and are under review. GP
Literature cited
- Dam, W. and S.-M. Ho, “Unusual design considerations drive selection of Sakhalin LNG plant facilities,” Oil & Gas Journal, Vol. 40, 2001.
- Khan, M. S., et al., “Knowledge-based decision-making method for the selection of mixed-refrigerant systems for energy-efficient LNG processes,” Applied Energy, Vol. 111, 2013.
- Venkatarathnam, G., Cryogenic Mixed Refrigerant Processes, Springer Science+Business Media LLC, New York, New York, 2008.
- Wauquier, J.-P., Petroleum Refining: Separation Processes, Technip, Paris, France, 2000.
 |
Ivan Nemov is a Senior Process Control Engineer who worked at Sakhalin Energy Investment Company Ltd. from 2012–2017, mainly supporting Sakhalin LNG plant operation. In 2017, he joined Shell Australia Pty. Ltd. for commissioning and startup of the Prelude FLNG vessel. He earned his ME degree from Gubkin Russian State University of Oil and Gas in Moscow, Russia in 2012 and teaches as an Assistant Professor at Astrakhan State Technical University in Astrakhan, Russia.


Comments