
Operational considerations of side reactions in gas sweetening systems—Part 2
In sour gas treating systems, several potential side reactions produce unwanted byproducts. These reactions depend on reactant concentrations, reactant absorption rates, temperature, kinetic rates and residence times. Appropriate prediction of the rates of these side reactions can give greater insight into the process, in terms of degradation rate and impact of operating conditions.
Three reactions are examined in the context of a typical amine treating process: (1) conversion of hydrogen cyanide to formic acid, (2) hydrolysis of carbonyl sulfide (COS) in methyldiethanolamine (MDEA) and (3) carbon dioxide (CO2) degradation of diethanolamine (DEA). The authors explore the occurrence of these reactions throughout the process and the effect of operating conditions through use of simulation. Part 1, published in the July/August issue, covered cyanide hydrolysis, while Part 2 discusses COS hydrolysis and CO2 degradation of DEA.
COS hydrolysis. With tightening regulations on the total sulfur content of treated products, increasing attention is being paid to organic sulfur contaminants and to what extent they are removed by amine solvents. A significant organic sulfur component is COS. As with CO2, the rate of absorption of COS can be influenced by chemical reactions occurring in the liquid phase. Accurately accounting for the impact of the reaction kinetics can allow for better prediction of the rate of COS absorption in an amine treating system, or at least reveal the benefits to be expected at different operating conditions.
COS can undergo several reactions (Eqs. 4–7) that are somewhat analogous to CO2:
Reaction with water:
COS + H2O → CO2 + H2S (4)
Reaction with hydroxide:
COS + OH– → CO2 + HS– (5)
Reaction with water, base-catalyzed by MDEA:
COS + MDEA + H2O ←→ MDEAH+ + HCO2S– (6)
Reaction with primary or secondary amine:
COS + 2R2NH ←→R2NCOS– + R2NH2+ (7)
The reaction in Eq. 7 is an abbreviation of a zwitterion formation with multiple deprotonation paths.
These reactions occur at very different rates. For comparison, we can define an apparent rate constant kapp for the forward reaction in Eq. 8:
rCOS = –kapp [COS] (8)
This form assumes that the effect of the concentration of any co-reactant, such as hydroxide or MDEA, is wrapped into kapp. In this form, it is possible to compare the relative rates for the various reactions using a nominal value for the co-reactant (Table 2). Similar to the CO2 reaction series, the H2O and OH– reaction rates are nearly negligible compared to the amines. MDEA is notably faster than those two. The primary and secondary reactions are significantly faster than MDEA.
 |
Danckwerts2 offers criteria for when a gas absorption reaction will be significant to the timescale of a specific location and whether it will impact the absorption of a reacting component. In the case of the reacting absorber, we are interested in whether a reaction will take place in the timespan of a tray. The criterion for negligible reaction is shown in Eq. 9:
![]() (9)
(9)
where τ is the residence time of the liquid on the tray.
With a typical value of 1 sec, the left side corresponds to the third column of Table 2.3–6 Based on this criterion, the water and hydroxide reactions can be neglected on a tray. The MDEA reaction may be on the border, but it should not be inconsequential. If a component being absorbed reacts fast enough, it will not only react in the bulk of the liquid but will also change the concentration profile in the liquid film near the interface, enhancing mass transfer. A criterion for negligible film reaction is shown in Eq. 10:
![]() (10)
(10)
where DA is the diffusivity of the absorbing reactant in the liquid, and kL is the liquid film mass transfer coefficient.
Table 3 shows the values for several amines considered to assume a diffusivity of 2 × 10⁻⁹ m2/sec and a mass transfer coefficient of 2 × 10⁻⁴ m/sec. The primary and secondary amine reactions are clearly fast enough to impact the film profile, while the MDEA reaction is unlikely to have a sizeable impact on mass transfer.
 |
COS + MDEA + H2O ←→ MDEAH+ + HCO2S– (11)
Calculating the impact of the enhanced mass transfer due to film reaction is beyond the scope of this work. However, the MDEA reaction has been shown to be non-negligible on the tray and slow enough to be handled as a “bulk” reaction. The MDEA reaction in Eq. 11 is the first of two (Eq. 12) interacting reactions:5
![]() 12)
12)
The first reaction to form protonated MDEA and monothiocarbamate (MTC) is reversible. The second reaction is the conventionally thought of “hydrolysis” forming H2S and CO2. This reaction is essentially irreversible. The first reaction is faster than the second by about a factor of 30, so the MTC will build up and the first reaction will eventually slow down. This effect is shown in Fig. 10. The solvent enters the absorber with no COS, and the reaction rate is relatively high. As the solvent saturates in COS, the forward rate speeds up. Since the second reaction is slower, the intermediate product accumulates (Fig. 11) and the forward reaction slows down significantly, until there is almost no net COS reaction at the bottom of the absorber, despite relatively higher temperature. Also, as the solvent loads up with acid gases, the molecular MDEA diminishes as it is protonated.
 |
|
FIG. 10. COS conversion in absorber. |
 |
|
FIG. 11. Liquid concentration of COS and monothiocarbamate by tray. |
Table 4 shows the net effect of the reaction on the absorption of COS into the MDEA. The main observation is that COS absorption by 40 wt% MDEA is low; approximately 0.5% is absorbed in the case of no reaction. When the reaction is added, the absorption is increased by a factor of four to more than 2%.
While this low solubility may seem surprising considering the behavioral analog between COS and CO2, it is important to remember that the solubility of molecular CO2 is not large. It is only when the CO2 reaction products HCO3– and CO32– are included does the CO2 solubility appear more significant. Since the COS reactions occur approximately two orders of magnitude slower than CO2, this may not show up as a solubility increase in the bulk of the solvent, let alone in the mass transfer across the liquid film.
If greater COS reaction is desired, several steps can be taken. Table 5 shows the impact of several possibilities. The fact that none of them change the behavior significantly further reinforces the concept that the reaction is becoming equilibrium-limited at the bottom of the column.
Once again, the incorporation of the reaction kinetics answers an important question in the amine gas treating system. Namely, with the consideration of hydrolysis, how much more will MDEA absorb COS above physical solubility? The answer is that it improves significantly, but the net “solubility” is still not large.
DEA degradation. Primary and secondary amines are susceptible to degradation at higher temperature in the presence of CO2. Understanding the kinetics of these reactions can allow amine plant operators to troubleshoot the source of the amine degradation and potentially modify their process to reduce its impact. Several resources describe the major steps of the mechanism of degradation for diethanolamine (DEA) as:
- DEA + CO2 ←→ DEA carbamic acid
- DEA carbamic acid ←→ 3–(2-hydroxyethyl) oxazolidone (HEOD) + H2O
- HEOD + DEA → N,N,N’-tris(2-hydroxyethyl)ethylenediamine (THEED) + CO2
- THEED → N,N’-bis(2-hydroxyethyl) piperazine (BHEP) + H2O
The later degradation products THEED and BHEP are formed by irreversible reactions that permanently diminish the solvent’s performance. They do have the capacity for holding CO2 in solution through protonation and forming carbamates; however, they are less effective per mass of amine than the original DEA. In addition, BHEP and THEED are suspected of enhancing corrosion in process equipment. Finally, THEED also has the potential to form polymeric materials leading to fouling. Obviously, the capacity to predict this behavior in the wide range of reaction locations would be useful for an amine plant operator.
Kim and Sartori7 provide a kinetic model for this process. The kinetic parameters not provided in the original paper were regressed from the experimental data of Kennard,8 as shown in Eqs. 13 and 14:
DEA + CO2 ←→ HEOD + H2O (13)
HEOD + DEA → THEED + CO2 (14)
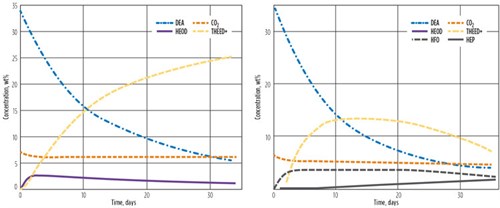
The first reaction consumes CO2, while the second reaction produces CO2. In this manner, CO2 acts somewhat like a catalyst to the degradation process. Fig. 12 shows how the degradation model compares to the data of Kim and Sartori.7 The DEA and CO2 concentrations follow the experimental data very closely. The model HEOD value does not rise as high as the data, but the initial rise of THEED matches quite well. In the model, the THEED represents all permanent degradation products; in the data, the THEED later reacts to other components.
 |
|
FIG. 12. Comparison of model to data4 (248 F at variable pressure). |
To demonstrate the predictive nature of the reaction model, simulations were configured to represent data from other authors. The comparisons to literature laboratory degradation studies9,10 are shown in Table 6. While the simulation model slightly overpredicted DEA degradation with the results of other studies,9,10 it was reasonably close.
 |
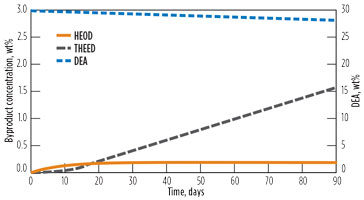
This kinetic model has been applied to the standard simulation, using 30 wt% DEA with no starting degradation products. The results are shown in Table 7. DEA is consumed in both the HEOD formation and the THEED formation reactions. Table 7 shows the net forward rate of the HEOD formation reaction (Rate 1) and the rate of the THEED formation reaction (Rate 2). The final column is the combined rate, indicating total DEA loss.
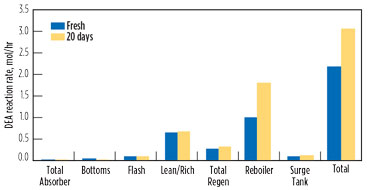
Fig. 13 shows the progress of the reactions over time, including the accumulation of HEOD and THEED. One can observe that HEOD approaches a near-steady-state value of 0.25 wt% after approximately 20 d.
 |
|
FIG. 13. Time profile of DEA system degradation. DEA is represented on the secondary axis. |
Once this initial buildup profile is established, the reaction rates change. The net forward reaction of the DEA ←→ HEOD reaction slows down with more product HEOD, while the second reaction accelerates with more reactant HEOD. Fig. 14 shows this change, comparing the fresh solvent with the system after 20 d of operation. Most of the prior locations are dominated by the first reaction; as such, there is little change between the fresh solvent and the solvent used for 20 d of operations. One noticeable difference is the reboiler, where the second reaction (HEOD → THEED) increases significantly at the higher HEOD concentration.
 |
|
FIG. 14. Comparison of DEA degradation reaction by location at two times. |
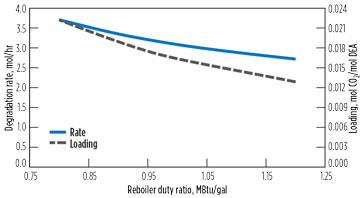
Like the HCN reaction examined earlier, most of the reaction is occurring in the reboiler and regenerator. As with that reaction, two possibilities for reducing the degradation are to increase the reboiler duty to drive off CO2, or to reduce the regenerator pressure, thereby reducing temperature and possibly lowering CO2 concentration. Fig. 15 shows the effect of reboiler duty on the combined loss of DEA. As the reboiler duty increases, the CO2 content of the solvent decreases and reduces the reaction rate of the first reaction. Reaction data is chosen at the quasi-steady-state HEOD level.
 |
|
FIG. 15. Effect of duty on DEA degradation. |
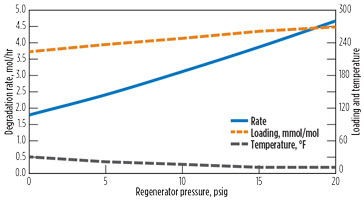
Fig. 16 shows the impact of regenerator pressure. As the pressure increases, CO2 concentration decreases, but the net reaction rate increases due to the increase in reboiler temperature.
 |
|
FIG. 16. Effect of regenerator pressure on DEA degradation. |
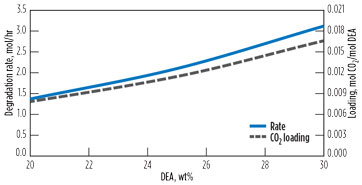
One other possibility for managing the degradation rate is decreasing the DEA concentration. Fig. 17 shows this effect. The circulation rate is increased to maintain similar rich loading. Since both forward reaction rates are linear in DEA, one would expect the reaction rate to drop by approximately one third as the DEA concentration drops from 30% to 20%. However, the reaction rate drops by more than 50%. As the DEA strength decreases, the lean loading at the reboiler remains about the same, so the CO2 concentration drops along with the DEA. This slows the first reaction and, consequently, lowers the quasi-steady-state value of the HEOD.
 |
|
FIG. 17. Effect of DEA strength on degradation. |
In the case of the DEA degradation reactions, the “instigator” of the reaction is not a contaminant that can be scrubbed out or avoided, but rather the process itself (CO2/DEA) that is causing the damage. The reaction-enabled simulation offers a view as to how the process conditions impact the long-term health of the amine treating system.
Takeaway. The utility of combining experimentally determined reaction kinetics with a commercial simulator has been demonstrated for a variety of reactions relevant to gas treating. Some specific observations about the reactions include:
- Hydrogen cyanide will convert to formic acid, primarily in the regenerator column and surge tank. To reduce the reaction, the reboiler duty is kept high while the reboiler temperature is kept low.
- COS is reactive in MDEA/water solutions, but the solubility is low enough that absorption is small.
- DEA degradation in the presence of CO2 happens primarily in the regenerator reboiler. The degradation rate accelerates for the first few weeks of operation, beginning with a clean solution before stabilizing. As with cyanide, reducing regenerator pressure and increasing reboiler duty reduce the reaction rate. In addition, lowering amine strength lowers the degradation. GP
Literature cited
2. Danckwerts, P. V., Gas-Liquid Reactions, McGraw-Hill, New York, New York, 1970.
3. Thompson, Kearton and Lamb, “The kinetics of the reaction between carbonyl sulfide and water,” Journal of the Chemical Society, 1935.
4. Sharma, M. M., “Kinetics of reactions of carbonyl sulfide and carbon dioxide with amines and catalysis by Bronsted bases of the hydrolysis of COS,” Transactions of the Faraday Society, 1965.
5. Littel, R. J., W. P. van Swaiij and G. F. Versteeg, “Kinetic study of COS with tertiary alkanolamine solutions: 1. Experiments in an intensely stirred batch reactor,” Industrial and Engineering Chemistry Research, 1992.
6. Huttenhuis, P. J., A. Mohan, S. van Loo and G. F. Versteeg, “Absorption of carbonyl sulfide in aqueous piperazine,” IChemE 8th International Conference on Distillation and Absorption, London, UK, 2006.
7. Kim, C. J. and G. Sartori, “Kinetics and mechanism of diethanolamine degradation in aqueous solutions containing carbon dioxide,” International Journal of Chemical Kinetics, 1984.
8. Kennard, M. L., Degradation of Diethanolamine Solutions, University of British Columbia, 1983.
9. Lepaumier, H., D. Picq and P. L. Carrette, “Degradation study of new solvents for CO2 capture in post-combustion,” Engergy Procedia, 2009.
10. Eide-Haugmo, I. L., A. Einbu, K. Vernstad, E. F. da Silva and H. F. Svendsen, “Chemical stability and biodegradability of new solvents for CO2 capture,” Energy Procedia, 2011.
Note
This work was originally presented at the Laurance Reid Gas Conditioning Conference in Norman, Oklahoma, February 26–March 1, 2017.
 |
Gavin McIntyre is Manager of Process Applications and Technical Support for Bryan Research & Engineering. He has 24 yr of experience in oil and gas, with focuses in sour gas treating and gas processing. Mr. McIntyre has held previous roles in sales and support for Bryan Research & Engineering's ProMax process simulation software. He holds a BS degree in chemical engineering from Texas A&M University.
 |
Christina Daniels is a Senior Technical Service and Development Engineer at INEOS GAS/SPEC Technology Group in Freeport, Texas. She has 25 yr of experience in the amine industry, including process design of new facilities and troubleshooting, training, simulation and optimization of existing facilities. She holds a BS degree in chemical engineering from Texas A&M University and an MS degree in chemical engineering from Iowa State University.
 |
Erik Stewart is the Freeport Site and Global Technical Manager for INEOS GAS/SPEC Technology Group in Freeport, Texas. He has 30 yr of expertise in amine, gas and liquid treating applications for natural gas production, refining and ammonia applications, with many industry reference publications. He holds a BS degree in chemical engineering from the University of Washington.
 |
Joel Cantrell is a Development Engineer with Bryan Research & Engineering. He has 20 yr of experience in a variety of oil and gas process engineering capacities, including advanced process control and optimization, and process economics. For a number of years, he was involved with process development and pilot plant operation for a GTL and biofuels production processes. He has also participated in mass and heat transfer model development and advanced applications for the ProMax simulation software. Dr. Cantrell holds a BS degree from Texas A&M University and a PhD from Lehigh University, both in chemical engineering.


Comments