
US Industry Metrics
8/1/2018
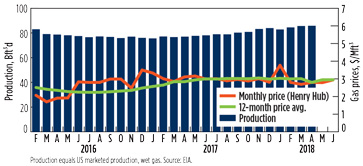
US natural gas supply and consumption expanded significantly from H1 2017 through H1 2018. According to PointLogic Energy, total gas use in the Lower 48 states averaged 87.4 Bft3d during H1 2018, an 11% rise from the same period last year. Total gas supply averaged 84.8 Bft3d in H1 2018, representing a 10% increase on the year. The increase in supply was led by dry gas production, which expanded by 7.4 Bft3d on the year in H1 2018. GP
 |
|
US natural gas spot prices at Henry Hub and NGL spot prices at Mont Belvieu, $/MMBtu |
 |
|
US gas production (Bft3d) and prices ($/Mcf) |
 |
|
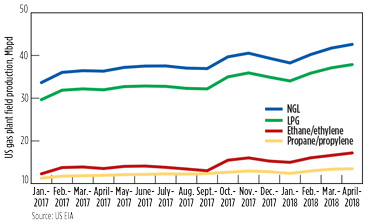
US natural gas plant field production of NGL, LPG, ethane and propane, Mbpd |


Comments