
Operational considerations of side reactions in gas sweetening systems—Part 1
In sour gas treating systems, a number of potential side reactions produce unwanted byproducts. These reactions depend on reactant concentrations, reactant absorption rates, temperature, kinetic rates and residence times. Appropriate prediction of the rates of these side reactions can give greater insight into the process, in terms of degradation rate and impact of operating conditions.
Three reactions are examined in the context of a typical amine treating process: (1) conversion of hydrogen cyanide to formic acid, (2) hydrolysis of carbonyl sulfide (COS) in methyldiethanolamine (MDEA) and (3) CO2 degradation of diethanolamine (DEA). The authors explore the occurrence of these reactions throughout the process and the effect of operating conditions through the use of simulation. Part 1 discusses cyanide hydrolysis, while Part 2 will cover COS hydrolysis and CO2 degradation of DEA.
Introduction to treating reactions. A great number of chemical reactions occur in gas treating, ranging from water dissociation to piperazine dicarbamate hydrolysis. For the most part, these reactions are reversible and tend toward equilibrium. Some reactions are not reversible and represent a permanent chemical change in the process. These irreversible reactions fall into two major categories: degradation of the solvent and conversion of gas contaminant components. The extent of these reactions is seldom taken into account in simulation, and generally not in a rigorous fashion. These reactions are generally slow reactions with time constants of days, weeks or months. This slow behavior also makes research and quantification of the kinetics difficult and relatively rare.
One of the difficulties in assessing these side reactions in gas treating systems is the large number of places the reactions can occur in the gas treating system, including in the absorber trays or packing, absorber bottoms holdup, rich flash, lean/rich exchanger, stripper column, reflux drum, reboiler and surge tank, as well as in other areas, such as in the sour water stripper or liquid-liquid separators. In addition to the uniqueness of reaction kinetics, each point of possible reaction has its own reaction conditions (concentration, temperature and residence time).
The three reactions examined here are hydrolysis of cyanide, hydrolysis of carbonyl sulfide in the presence of MDEA, and the degradation of DEA. In each case, the reaction kinetics are reviewed to demonstrate how well the reaction matches with published laboratory or plant data. Then, a simulation of a typical amine process is used to show where the reaction occurs and to what extent. From these observations, a reasonable process for remediation can be assessed.
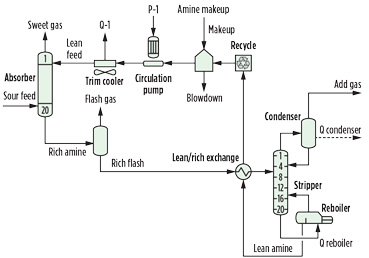
Typical amine process. The amine process (Fig. 1) examined is purely hypothetical and is used to demonstrate the impact of side reactions. The absorber and regenerator columns have 20 trays with 2-in. weirs. Both of the columns are sized for 70% of flooding. The flash tank operates at 75 psia, and the lean/rich exchanger produces a rich solvent with a temperature of 210°F. In this process, a surge tank is included after the lean side of the lean/rich exchanger. Inlet sour gas is 800 psia and 110°F, while the lean amine enters the column at 120°F. The regenerator condenser operates at 120°F.
 |
|
Fig. 1. Typical amine treating process. |
The reactions described in this work are kinetically limited and modeled using a perfectly mixed reactor, which is also referred to as a continuously stirred tank reactor (CSTR). One of the important factors in determining the extent of the reactions is the amount of time that the reaction mixture remains at a particular condition. These liquid residence times vary from plant to plant, but the following holdup times may be used as representative of a typical plant:
- Absorber bottoms: 3 min
- Reflux accumulator: 10 min
- Flash tank: 10 min
- Reboiler: 3 min
- Surge tank: 10 min
- Lean/rich exchanger: 1 min.
This analysis will also examine the reactions in the mass-transfer portion of columns. The tray liquid residence times depend on column hydraulics, but typically vary from 1 sec–3 sec.
Cyanide hydrolysis. Hydrogen cyanide is a common contaminant in refinery gases, especially in more severe processing units, such as fluidized catalytic crackers and coking units. It is a weak acid with lower volatility than H2S and CO2, which allows it to become trapped by water and amine systems. It can be driven out of the solution with enough heat, but it accumulates to some extent in a recycled amine loop. As a weak acid, it diminishes the ability of the amine to remove acid gases; however, the bigger concern is the potential to form heat-stable salts (HSS). Once in the aqueous phase, it reacts with hydroxide ions to form ammonia and formate ions. Ammonia is an operational problem in the regenerator, while the formate ions can cause increased corrosion. According to Wiegand and Tremelling,1 the reaction occurs as shown in Eqs. 1–3:
HCN + OH– + H2O → NH3 + HCO2– (1)
with the kinetic rate expression:
rHCN = k[HCN][OH–] (2)
where the rate constant takes the standard Arrhenius form:
![]() (3)
(3)
This reaction is first order in both cyanide and hydroxide. To demonstrate the reasonableness of the kinetic model, a simulation was constructed to represent a case described by Wiegand and Tremelling.1 They wrote that a 0.25 N solution of cyanide lost 0.00024 N/d in cyanide concentration at room temperature. While the proprietary simulator used in this case cannot simulate a batch reactor in time, the plug flow reactor model with the appropriate flow and reactor dimensions can simulate such a reaction as an analog in space. With a 1-liter (l) reactor and a 1-l/d liquid flow, the 0.00024 N/d loss rate was reproduced at 79°F, within the range of room temperature.
The simulation case has an inlet sour gas with 50 ppm of HCN. Knowing that the process will generate ammonia, the regenerator column has a purge that is 5% of the reflux flow. As a base case, the regenerator operates at 10 psig and has a reboiler duty of 1 MBtu/gal of circulation. The solvent is 40 wt% MDEA with a circulation rate of 130 gpm, giving a treated gas concentration of 1.5 mol% CO2, 0.1 ppm H2S and essentially zero HCN. The rich and lean total loadings are 0.3 mole acid gas/mole amine and 0.002 mole acid gas/mole amine, respectively.
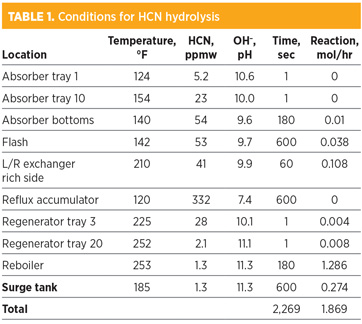
Table 1 shows the reaction conditions at several locations in the process. As one might expect, the highest HCN concentration is at the bottom of the absorber and the regenerator reflux accumulator, while the highest temperature is in the regenerator reboiler. The hydroxide concentration is highest in the lean amine.
 |
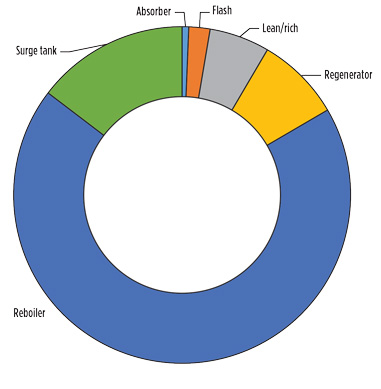
Due to the confluence of time, temperature and hydroxide concentration, the lower section of the regenerator, the reboiler and the surge tank have the highest reaction extent. This proportion is represented in Fig. 2.
 |
|
Fig. 2. Proportion of reaction by unit operation. |
Since formate is an HSS, it does not naturally come out of the amine circulation loop, and it will continue to accumulate over time. The information in Table 1 assumes that the formate level in the lean amine that travels to the absorber is zero. This level is achieved by artificially removing the formate after the surge tank on each cycle. At the operating condition shown, formate would be expected to accumulate at a rate of 1.87 gram-moles/hr, or 4.5 lb/d.
As a comparison, 108 lb/d of HCN are absorbed into the system. The liquid holdup shown corresponds to approximately 40 min of flow, or about 5,000 gal. On a mass basis, the formate accumulation rate is approximately 100 ppmw/d of formate. This accumulation rate clearly indicates a motivation to remove cyanide prior to entering the amine system. Cyanide removal is commonly accomplished with a water/ammonium polysulfide wash.
Unlike the formate, the ammonia byproduct has an exit route in the reflux purge. Only a small fraction of the ammonia produced in the amine loop is not rejected in the regenerator column and will recycle back to the absorber, so buildup is not significant.
As mentioned, the reaction data shown is for a clean, formate-free solvent.
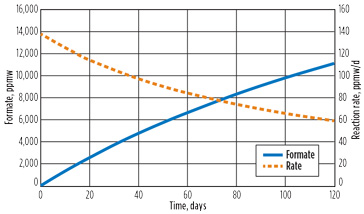
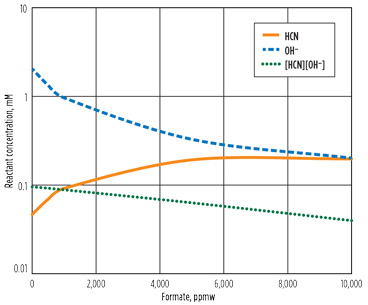
As the formate builds up, the reaction behavior is expected to change. Fig. 3 shows the accumulation of formate and the reaction rate over time. At 10,000 ppm of formate, the reaction rate is half of the clean solvent rate. The cause of this rate difference can be explained from Fig. 4a. As the formate level increases, the hydroxide in the reboiler is reduced and the product of the cyanide and hydroxide decreases, thereby minimizing the reaction.
 |
|
Fig. 3. Time profile of formate and reaction rate. |
 |
 |
|
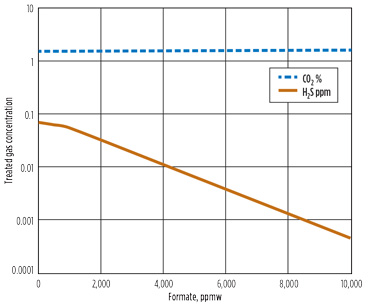
Fig. 4. Effect of formate on (A) reboiler reactant concentration and (B) treated gas. |
An additional effect of the formate accumulation is the treatment performance. Fig. 4b shows the treated acid gas concentrations for a range of formate concentrations. As the formate level rises, the lean amine becomes leaner in H2S with the same reboiler heat input, and the treated gas H2S level decreases. At the same time, the formate shifts the ionic balance of the amine, leaving less free amine, which causes the treated CO2 level to rise slightly.
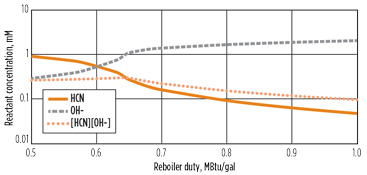
Given that increasing the acid in the reboiler can reduce the amount of cyanide reaction occurring, one possible operating change would be to lower the reboiler duty, allowing for a less lean amine. Fig. 5 shows this effect. As the reboiler duty as a ratio to circulation rate is decreased, the hydroxide concentration does indeed decrease. However, with less reboiler duty, more HCN concentrates at the bottom of the column. At a low enough duty (e.g., a reboiler ratio of approximately 0.65 MBtu/gal), a cyanide “bubble” forms in the column, and the concentration in the reboiler increases dramatically. At this point, the hydroxide concentration also drops off.
 |
|
Fig. 5. Effect of reboiler duty on reboiler concentration. |
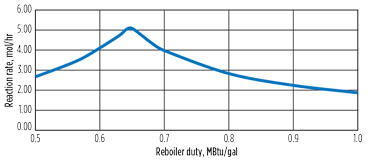
This combined effect can be seen in the reactant product ([HCN][OH–]), which goes through a peak at a reboiler duty ratio of 0.65. The reaction rate for the system shows a similar peak in Fig. 6, with the reaction rate at a reboiler duty of 0.65 MBtu/gal, more than twice as fast as the base case reboiler duty of 1.
 |
|
Fig. 6. Effect of reboiler duty on reaction rate. |
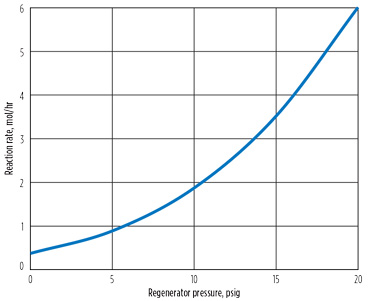
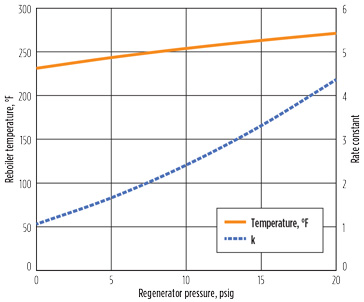
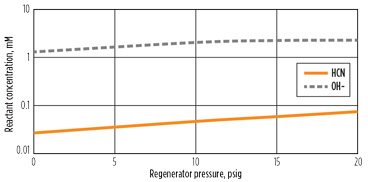
Decreasing the reboiler duty did not reduce the cyanide reaction rate, but it is possible that a reduced reboiler temperature would reduce the reaction rate constant, as well as the reaction rate. Since the temperature of the reboiler is primarily governed by the regenerator pressure, the pressure of the regenerator was varied to explore its impact on the reaction rate. Fig. 7 shows this effect. As expected, reducing the pressure reduced the reaction rate. In this case, dropping the pressure from 20 psig to 0 psig reduces the reaction rate by a factor of approximately 16. However, the second plot indicates that the effect of temperature on the rate constant accounts for a factor of only 4. Note: The condenser was still specified at 120°F. As shown in Fig. 8, the lower pressure reduces both cyanide and hydroxide concentration in the reboiler, explaining the additional reduction in reaction at low pressure.
 |
 |
|
Fig. 7. Effect of regenerator pressure on reaction. |
 |
|
Fig. 8. Effect of regenerator pressure on reboiler concentrations. |
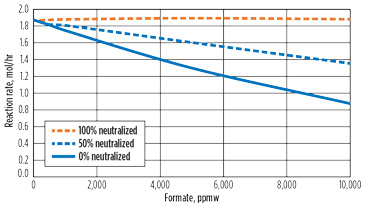
One common technique to reduce corrosion in the presence of acids is to neutralize the solution by adding a caustic. However, because hydroxide is a reactant to the formic acid production reaction, this could cause an acceleration of the reaction. Fig. 9 shows the effect of adding KOH to neutralize the acid content. As the caustic increases, the rate of reaction increases relative to the un-neutralized solution. At full neutralization, there is essentially no reaction rate slowdown due to formate accumulation.
 |
|
Fig. 9. Effect of caustic neutralization. |
While the rate of HCN hydrolysis in one pass of an amine treating system is small, the fact that the reaction product accumulates requires that the rate of accumulation and, consequently, the rate of reaction be accounted for in the process simulation. The impact is important both in the short-term prediction of treating performance and in the long-term management of the solvent.
Part 2 of this article will cover COS hydrolysis and DEA degradation, and share observations about the utility of combining experimentally determined reaction kinetics with a commercial simulator for treating applications. GP
Note
This article was originally presented at the Laurance Reid Gas Conditioning Conference in Norman, Oklahoma, February 26–March 1, 2017.
Literature cited
1 Wiegand, G. H. and M. Tremelling, M. “The kinetics and mechanism of the decomposition of potassium cyanide in aqueous alkaline medium. Hydrolysis of the simplest nitrile,” HCN, Journal of Organic Chemistry, 1972.
 |
Gavin McIntyre is Manager of Process Applications and Technical Support for Bryan Research & Engineering. He has 24 yr of experience in oil and gas, with focuses in sour gas treating and gas processing. Mr. McIntyre has held previous roles in sales and support for Bryan Research & Engineering's ProMax process simulation software. He holds a BS degree in chemical engineering from Texas A&M University.
 |
Christina Daniels is a Senior Technical Service and Development Engineer at INEOS GAS/SPEC Technology Group in Freeport, Texas. She has 25 yr of experience in the amine industry, including process design of new facilities and troubleshooting, training, simulation and optimization of existing facilities. She holds a BS degree in chemical engineering from Texas A&M University and an MS degree in chemical engineering from Iowa State University.
 |
Erik Stewart is the Freeport Site and Global Technical Manager for INEOS GAS/SPEC Technology Group in Freeport, Texas. He has 30 yr of expertise in amine, gas and liquid treating applications for natural gas production, refining and ammonia applications, with many industry reference publications. He holds a BS degree in chemical engineering from the University of Washington.
 |
Joel Cantrell is a Development Engineer with Bryan Research & Engineering. He has 20 yr of experience in a variety of oil and gas process engineering capacities, including advanced process control and optimization, and process economics. For a number of years, he was involved with process development and pilot plant operation for a GTL and biofuels production processes. He has also participated in mass and heat transfer model development and advanced applications for the ProMax simulation software. Dr. Cantrell holds a BS degree from Texas A&M University and a PhD from Lehigh University, both in chemical engineering.


Comments