
Flow assurance study of gathering pipeline system at a gas condensate field
Increasing demand for energy, along with fluctuations in oil and natural gas prices, require a review of existing production, transportation and storage technologies for oil and gas. New technologies have been introduced for oil and gas well development that enhance production economics and efficiency. These technologies are showing success for drilling and production operations. However, a major obstacle has arisen as companies dig deeper underwater and underground: How to economically deliver valuable hydrocarbon resources from the reservoir to the end user. To this end, oil and gas producers and scientists have coined a new term: flow assurance.
Flow assurance refers to the successful and economical flow of hydrocarbon streams from the reservoir to the point of sale. By definition, flow assurance focuses on the entire engineering and production lifecycle, from the reservoir through processing and refining, to ensure that hydrocarbons can be moved from the reservoir to the refinery smoothly and without interruption.
Flow assurance is a diverse field, encompassing many discrete and specialized subjects, and bridging the full series of engineering disciplines. Financial losses from production interruption or asset damage due to flow assurance mishaps can be astronomical.
According to the American Petroleum Institute (API), the term flow assurance can be used to cover a wide range of flow-related issues,1 including:
- Hydrates formation
- Wax formation
- Asphaltene formation
- Emulsions
- Foaming
- Scale formation
- Sand production
- Slugging
- Materials-related issues.
The obstacles of flow may differ according to whether the hydrocarbon being produced is oil or gas, but they coincide in some aspects. For example, wax and asphaltene deposits are obstacles encountered in oil production, while hydrates formation is a key obstacle found in gas production.
As Egypt enters the world of deepwater gas production, flow obstacles must be avoided. The Zohr and Atol discoveries are considered the future of gas production in Egypt, and much of Egypt’s gas output will come from them. Any disturbances in the production of these fields will not only affect the oil and gas sector, but also the power and industrial sectors.
Obstacles to flow assurance and how to mitigate them. During production from a gas condensate reservoir, the first obstacle that may be faced is how to deliver the hydrocarbon from the wells to the processing facility with minimum pressure drop. Pressure drop in a multiphase flow is a function of the flow pattern and liquid holdup. Determining the flow pattern and the liquid holdup in pipelines is essential to accurately predict pressure drop.
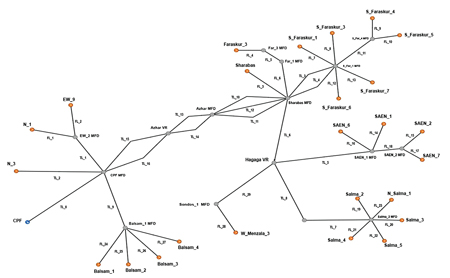 |
| FIG. 1. WASCO field pipeline gathering system. |
Slug flow occasionally occurs in multiphase flow, especially in offshore production facilities, which include a seabed pipeline and a riser to the processing platform. Accurate prediction of slug frequency is essential for proper processing facility design, including the sizing of slug catchers and separators.
The presence of free water in gas production pipelines aids the formation of hydrates under certain pressure and temperature conditions. Hydrates formation will partially or fully block the fluid flow in pipes, which results in backpressure on the wellhead and reduced well production. In the worst-case scenario, hydrates formation will kill the well. The prediction of hydrates formation in pipelines helps evaluate the problem and select the proper solution for solving it.
Producing a solids-free fluid may cause erosion to the pipeline if the fluid flow velocity exceeds a specific value. The determination of this value is important for the proper sizing of flow lines and the correct selection of an erosion rate for the pipes.
The change in network parameters, such as pressure, holdup or rates with time, is referred to as the transient state. Considering time as a parameter itself is important, as it affects the design of the pipeline in the network and/or the processing facilities. Ramping up the existing wells or introducing new wells to the network requires design consideration of the expected amount of liquid holdup in pipelines and the ability of processing facilities to handle the anticipated slugs. These slugs cannot be estimated without considering the time factor.
The design engineer must consider the maximum allowable working pressure (MAWP) of the pipelines while designing the network. The network MAWP can be reached and exceeded in case of the emergency closure of network delivery points to the downstream processing facility. Considering this case in design is crucial, as it may cause pipe blowing that leads to fire and explosions.
Pipeline pigging. Accumulated liquid in pipelines will cause an increase in pressure drop. This drop can be translated as a loss in energy. This loss must be compensated, resulting in higher cost. Moreover, accumulated water in pipes will increase the corrosion rate of the pipes. This liquid accumulation should be regularly removed from the pipe, using a pig.
A solid sphere with a diameter slightly less than the pipe diameter is inserted into the pipe and pushed, by some pressure source, to sweep the liquid ahead of it. The swept liquid should be accurately estimated to decide whether the existing facilities can handle the slug flow from the pig, or if an external handling facility is required to process and store the slug.
The timing of a pigging operation is a crucial parameter in the process, and is used to anticipate the pig reaching the end of the pipeline. If the predetermined time is exceeded, then the pig is expected to be stuck in the pipeline, and other procedures must be taken to retrieve it.
| |
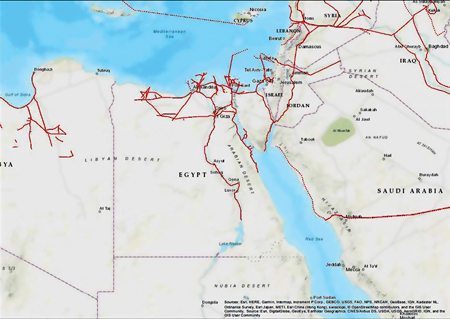 |
| Existing gas pipelines (solid lines) and proposed gas pipelines (dotted lines) in Egypt. Map courtesy of Energy Web Atlas, www.energywebatlas.com |
WASCO field production modeling. El-Wastani Petroleum Co. (WASCO) is a JV between Egyptian Natural Gas Holding Co. (EGAS) and Dana Gas Co. It was established in 2002 to produce sales gas and raw condensate from the El-Wastani field. The company was then expanded to produce from several other fields. The production is then gathered to the central processing facility (CPF) for gas treatment and NGL recovery and stabilization.
The producing fields extend more than 40 mi through three concessions: Menzala, West Menzala and West Qantara. The producing fields include El-Wastani, Dabayya, Bassant, Sharabas, Faraskur, Abu El-Naga, Salma and Balsam. Each field contains between one and seven producing wells. At present, there are 32 live, producing wells. The wellhead pressure range is 240 psi (16.5 barg)–4,750 psi (327.5 barg). The gas flowrate range is 0.5 MMsft3d–28 MMsft3d, with a condensate-to-gas ratio (CGR) of 4 bbl/ MMsft3–90 bbl/MMsft3 and a water cut range of 0%–90%.
The pipe network connects the fields’ wells and transfers the production to the CPF shown in Fig. 1. Each field’s wells are grouped together and gathered to one manifold. The fields’ manifolds are then connected through main trunklines. The network consists of carbon steel pipes with nominal diameters ranging from 6 in.–12 in. For pipes connecting wells with manifolds, 6-in. pipes are used, while 12-in. pipes are used for the main trunklines. For the main production header that connects the main manifold to the CPF, a 16-in. pipeline is used.
The well production is limited by the CPF design capacity of 200 MMsft3d and the inlet pressure of 782 psig. Fixed and adjustable chokes are used to reduce the flowing wellhead pressure to a suitable value; meanwhile, two nodal compression stations, each with a capacity of 20 MMsft3d, are used to raise the pressure of the low-pressure wells. The system has three high-water-cut wells that produce more than 80%. The high-water-cut wells are diverted to a two-phase separator at the wellsite to separate the water from the gas and condensate to protect the pipelines from corrosion.
A mathematical model is required to simulate the WASCO pipeline network at different conditions and scenarios. To construct and simulate the model, the company used a commercial software program with a transient, multiphase flow simulator. The model collects data from day-to-day activities, production logs, company archives and manufacturer manuals. The collected data is then sorted and filtered to eliminate irrelevant data. The data used for the study are pipeline length and inside diameter (ID), well depth and flowrate, CGR, and pressure–volume–temperature (PVT) analysis. The source nodes of the network are assumed to be downstream of the nodal compression stations and the separation packages for the high-water-cut wells.
Model results. The first run showed a great deflection of the model results from the actual data (up to 40% error). This deflection came from the fact that the model used the PVT data as a calculation base. The PVT samples were taken during the early production phase of the wells (2006–2010), while the test data was gathered in September 2016. To overcome this issue, the model was tuned using the actual CGR and water cut. A rerun was performed, giving an error of less than 10% from the actual production data. This means that the model was reliable and ready for further study.
The flow assurance study was performed on the network for the present flowing conditions. The parameters studied were pressure drop, flow regimes, liquid holdup, slug flow, erosion velocity and hydrates formation. The results are summarized in Table 1.
From the data in Table 1, Flowline 27 (“FL_27”) has the highest pressure drop gradient. Flowline 27 transports gas with a high flowrate (27 MMsft3d) and with a high CGR (51 bbl/MMsft3), which causes a high pressure drop. Trunkline 3 (“TL_3”) and Trunkline 4 (“TL_4”) have the highest pressure drop among the trunklines, due to the small pipe diameter (6 in.), compared to the flowrate (40 MMsft3d). The pressure profile across the main trunkline starting from the S-Faraskur-1 manifold to the CPF manifold is shown in Fig. 2.
 |
| FIG. 2. Pressure profile across trunklines in the system, calculated from the model. |
 |
| FIG. 3. Liquid holdup, percentage vs. gas velocity, ft/sec. |
The results show that slug flow is expected at the end of some branches. This is due to the hilly terrain effect of the pipelines. The pipelines are buried underground, while the connecting manifolds are aboveground. The elevation difference is approximately 10 ft, which causes the slug flow.
Table 1 suggests a direct relationship between the gas velocity and the liquid holdup in a pipeline. As the gas velocity increases, liquid holdup decreases (Fig. 3). The results indicate that a maximum hydrodynamic surge volume of 3.4 bbl of liquid is expected at the inlet of the plant. The processing facility should be designed to handle such a volume. The surge volume is small and can be handled by any processing facility, but in the case of a large surge volume, the condition is critical.
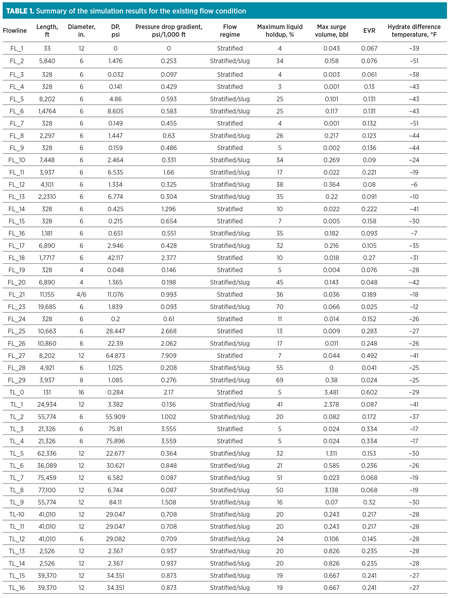 |
The erosion velocity ratio (EVR) is the ratio between the flow velocity and the erosion velocity of the pipe. If the EVR > 1, then erosion is expected. If the EVR < 1, then there is no erosion in the pipeline. Table 1 shows that the erosion of pipes due to fluid flow is not expected under the present conditions.
The hydrates formation prediction is calculated by the difference between the hydrates formation temperature and the fluid flow temperature for the specific pressure. If the difference is positive, then hydrates formation is expected. If the difference is negative, then hydrates are not expected to form. The results show that no hydrates are expected for the present flowing condition at the assumed ambient temperature. These results are expected, as the ambient temperature in the fields region is quite moderate and does not fall to the hydrates-forming temperature for the operating pressure and temperature. Hydrates formation is more likely to occur in marine fields, where the temperature falls below the hydrates-forming temperature at operating pressure, as the operating pressure is usually high.
Scenario simulation. The model can be used to simulate hypothetical scenarios. One scenario is to calculate the maximum capacity of the existing network to determine whether the network is capable of handling an increase in production, or if looping the pipelines is required to handle the excess production.
Several boundaries must not be ignored when selecting the maximum flowrate for the network:
- The pressure in the pipeline must not exceed the MAWP of the pipe material (in this case, 1440 psig).
- The pressure of the network must not exceed the lowest shut-in wellhead pressure (SIWHP) of the producing well; otherwise, the WHP of the wells will equalize with the network pressure, and the wells will cease to flow.
- The flow speed in the network must not exceed the design EVR. Erosion in the pipeline is expected if the flow speed exceeds that value, thereby reducing the lifetime of the network.
- The flow temperature should be high enough to avoid hydrates formation.
To simulate the selection of the maximum flowrate, taking into account these boundaries, the network is divided according to the six producing fields: El-Wastani, Bassant, Balsam, Faraskur, South Abu El-Naga (SAEN) and Salma. The production of each field is gathered and sent through a main trunkline. The maximum capacity for each trunkline is calculated separately and used to determine the maximum capacity of the network. A flow assurance study is then performed for the new flowrates.
Fig. 4 shows a comparison of the maximum capacity of the network while considering single fields, the entirety of the fields and the flow assurance study to the network. The dramatic drop in the calculated maximum capacity is due to the expected erosion in the main 16-in. trunkline due to high gas velocity. Looping that trunkline with another 16-in. trunkline will prevent erosion and increase the maximum capacity of the network.
 |
| FIG. 4. Comparison between production rates for maximum network capacity at each simulation |
 |
Another scenario is the emergency shutdown (ESD) case, which assumes that an emergency has occurred in the CPF that requires an ESD. This shutdown will cause the CPF inlet feed to cease. The wells will continue to produce until they reach their SIWHP. Some of the wells have an SIWHP that is less than the MAWP of the network pipelines. Other wells have an SIWHP greater than the MAWP of the pipelines.
During an ESD, the high-pressure wells will continue flowing and cause the network pressure to reach the MAWP. This can result in pipeline explosion and severe damage to assets, the environment and people. The time frame for the network pressure to reach the MAWP must be determined to avoid such a scenario. The previous scenario can be modeled to determine when the network pressure reaches the MAWP. It is assumed that the model will run normally for 120 sec, and then the ESD valve will close in 60 sec. Fig. 5 shows the CPF pressure with time. The MAWP of the network pipeline will be reached after 7,429 sec (124 min).
 |
| FIG. 5. CPF pressure with time. |
Another scenario that requires the transient simulation is the pigging operation. Pigs are used for the internal cleaning of the pipelines to remove rust, sand, scale and any solid deposits. Pigs are also used to sweep out the excess liquid that has settled at the bottom section of the pipes to minimize the pressure drop results from the multiphase flow.
In this scenario, pigging operations must be performed for the main trunklines to remove settled liquid in pipes, along with any other solid deposits, to minimize the pressure drop. After the pigging operation is completed, liquid slug is expected. This slug should be calculated so that the proper separation and storage facilities are in place to handle this slug at the pig receiving point.
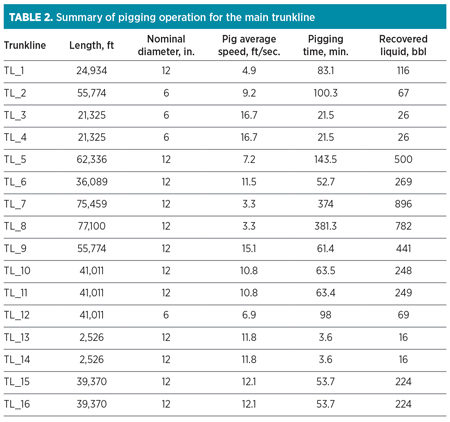
Fig. 6 shows an example of pig performance, including the position of the pig and the liquid content in the trunkline with time. The liquid content in the branch (red line) starts at the original value and then declines rapidly as the pig reaches the end of the line. After the pig reaches the trap at the end of the line, the liquid (water and condensate) starts to build up again in the pipeline. Fig. 6 also shows the position of the pig in the pipeline (black line) with time. The effect of pigging operations on pressure drop can be seen in Fig. 7 from the relationship between the liquid content and the upstream pressure. As the CPF pressure is constant, the drop in upstream pressure is due to the drop in liquid content in the pipeline. Table 2 summarizes the pigging operation of the main trunklines, including the pig speed, pigging time and recovered liquid.
 |
| FIG. 6. Pigging operation example for trunklines. |
 |
| FIG. 7. Effect of pigging operation for trunklines on source node pressure. |
Takeaway. The results show that the highest pressure drop occurred in the pipeline with the highest gas flowrate and liquid content. The hilly terrain was also found to have affected the flow regime of most of the pipelines, while the gas velocity in the pipelines directly affected the liquid holdup.
Results also indicated that the expected surge volumes from the network at the existing flowrates are relatively small, and that the processing facilities can handle them. No hydrates formation is expected in the network under the existing flowrate conditions and the ambient temperature. Also, the network flow velocity is adequate, and no erosion is expected.
Furthermore, the maximum capacity of the network is dramatically reduced, due to expected erosion velocity in the main trunkline. During ESD, the time for the network pipelines to reach MAWP is 124 min, for the existing flow conditions. Using this model, the surge volume expected from each trunkline during pigging operations can be calculated, along with the pigging time and the pig speed.
Recommendations. Following the study performed, it is recommended to carry out regular flow assurance studies with up-to-date data to assess the existing gathering system and forecast future drawbacks.
The PVT analysis should be updated regularly to stay current with the changes in composition of the produced fluid and its effect on the gathering system. Pigging operations should be performed on a regular basis to increase the integrity and readability of the pipeline. Also, network looping is an option to increase the capacity of the existing gathering system.
The presented model is reliable and ready for use in further flow assurance studies, such as ramp-up scenarios, pipeline depressurizing scenarios and others. GP
 |
Emad El-din M. Rabbeea is a Senior Process Engineer at WASCO
and a Flow Assurance Researcher at the Department of Engineering at Cairo University, where he is pursuing his master’s degree. He has 9 yr of experience in the oil and gas industry, with seven of them spent in gas processing engineering at WASCO. Mr. Rabeea has participated in several projects at WASCO, including major shutdowns and commissioning of new projects. He has also helped increase company production by participating in projects to revive old wells. He holds a BSc degree in petroleum engineering from Suez University and is a NEBOSH IGC-certified engineer.
 |
Dr. A. Abdel-Waly is a Professor of Oil and Gas Engineering at Cairo University in the Petroleum Department. Previously, he worked as a consultant for OSOCO Co., and as an Associate Professor at KSU in Saudi Arabia. He holds an MSc degree and a PhD in petroleum engineering, both from Cairo University. Dr. Abdel-Waly has supervised many MSc and PhD theses, as well as published several papers in the field of oil and gas reservoir and production engineering.


Comments