
US Industry Metrics
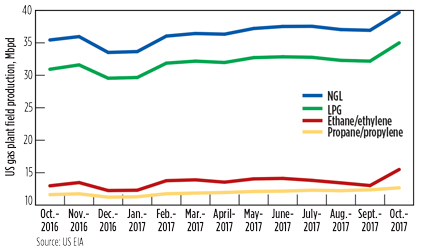
In the wake of January’s “bomb cyclone” weather event that brought freezing temperatures, snow and ice to a large portion of the US, Henry Hub natural gas spot prices rocketed upward as residential and commercial consumption of natural gas spiked. Demand climbed to 73.3 Bft3 on New Year’s Day, the highest level recorded since January 2014. The EIA noted that some of this demand was due to greater gas exports to Mexico and LNG feedstock gas, neither of which occurred in 2014. Meanwhile, US production of NGL increased significantly in the year through October 2017, especially LPG and ethane. GP
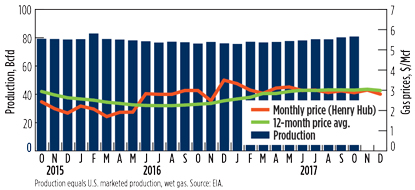 |
| US gas production (Bcfd) and prices ($/Mcf) |
 |
|
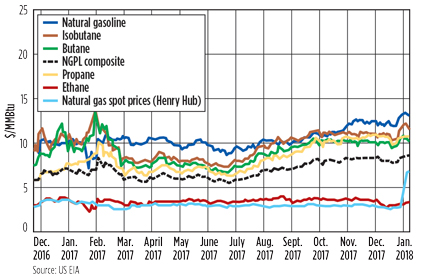
US natural gas spot prices at Henry Hub and NGL spot prices at Mont Belvieu, $/MMBtu |
 |
|
US natural gas plant field production of NGL, LPG, ethane and propane, Mbpd |


Comments