
Meet compression train base package design requirements for FPSOs—Part 2
E. ABRAHAM and H. MILLER, Dresser-Rand, a Siemens Power & Gas company, Olean, New York
Floating production, storage and offloading (FPSO) vessels are used throughout the world for the processing of oil and gas, for oil storage and for offloading to a tanker or through a pipeline. FPSOs can be subject to high winds and accelerations from the pitch, roll and heave of the sea. Continued safe operation of onboard equipment under both normal and adverse conditions is essential.
In Part 1 of this article (Gas Processing, September/October), the worldwide distribution of FPSOs, typical applications and base designs were discussed. As shaft-end relative displacement criteria are shown to be more limiting than the stress criteria, significant detail is included in finite element analysis (FEA) models to accurately calculate the shaft-end relative displacement. These details include more accurate modeling of the rotors, bearing connections, compressor pedestal sliding and keel blocks. Base modifications that are identified early in the manufacturing cycle are much easier to implement than those identified later.
Improvements in data gathering, FEA model preparation and the automation of worst-case load combinations have resulted in a 40% reduction in analysis time. Analytical models provide a valuable tool in assessing the suitability of three-point base package design for operation on FPSOs. Part 2 examines data gathering for the FEA, the construction of the FEA model and analytical results.
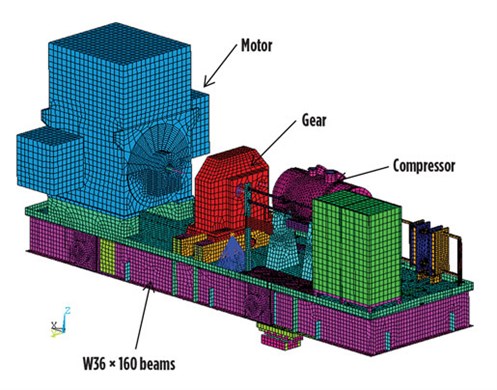
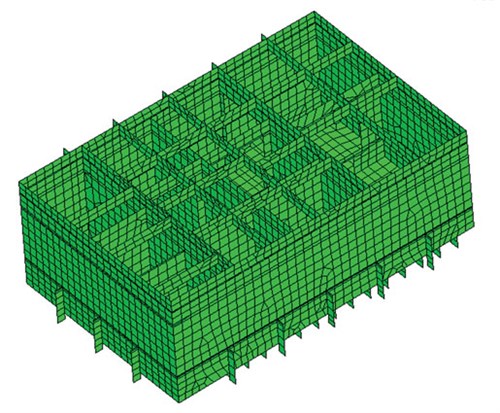
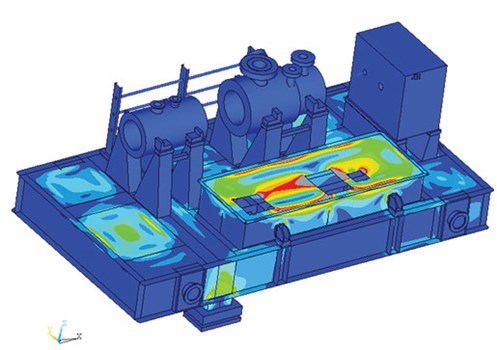
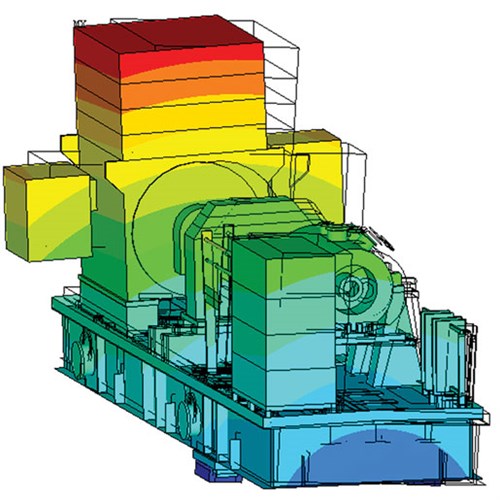
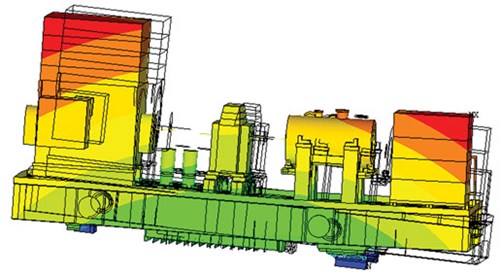
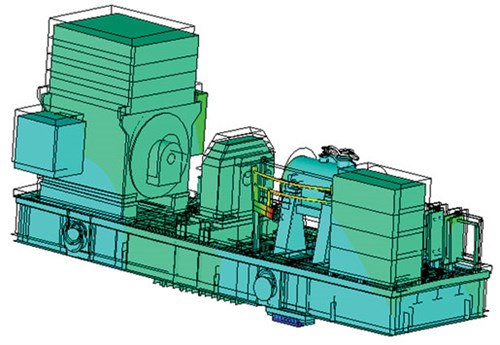
FEA model requirements. Hundreds of hours are required to perform an FEA. Gathering the required data, developing the FEA model, setting up and running scores of load cases, determining the worst-case combination of loads and evaluating results are time-consuming activities. Gathering the required data is discussed later in this work. Significant time reduction has been realized in the model development phase; additionally, programs have been developed to automatically determine the worst-case combination of nozzle loads and all operating loads. These automations are also discussed here. Views of the FEA model created for the base design from Figs. 19–21 are shown in Fig. 22 and Fig. 23.
|
|
|
FIG. 22. Typical FEA model of FPSO base package with large I-beams and no torque tubes. |
 |
|
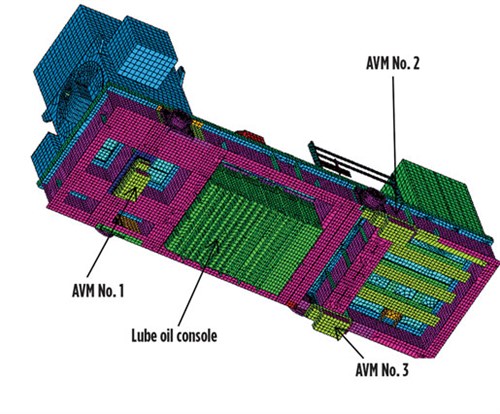
FIG. 23. FPSO base package with lube oil console under the gear to reduce deck area required (bottom view). |
Simplified models used by consultants in the past included rigid elements to represent the rotors attached directly to the tops of the pedestals. These types of models are less accurate for the prediction of shaft-end relative displacement. Additionally, they cannot be used to perform the unbalanced forced response analysis that is used to predict amplitude of vibration at the feet of the major equipment.
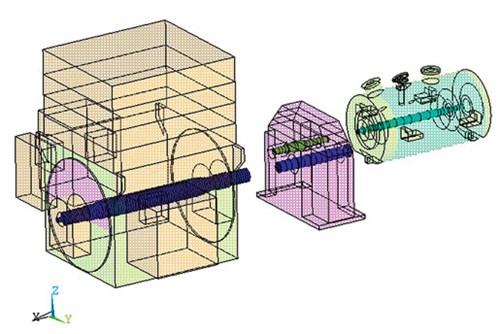
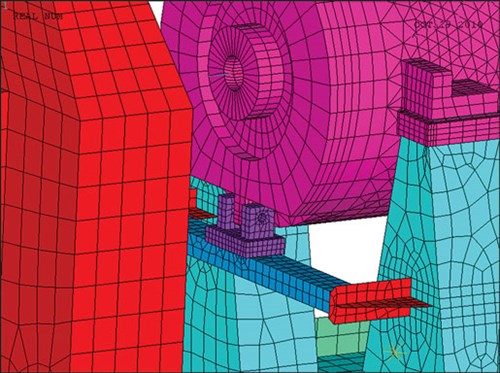
A number of FEA model details are included that result in a more accurate model. First, all rotors are modeled similarly to the modeling used for rotordynamic analysis. Stick-type (beam or pipe) elements are used to represent the stiffness and distributed mass of the compressor, gear and motor rotors, as shown in Fig. 24. Lumped masses are used for rotating components (e.g., impellers) with appropriate masses and mass inertias assigned. Rotordynamic model inputs for the compressor can be edited and read directly into the FEA code. Bearing stiffness is modeled with horizontal and vertical spring-type elements that run from the bearing locations on the rotor model to an appropriate location on the case model. The bearing damping is not included. If included in the design, keel blocks and sliding between the pedestal and the compressor foot should be modeled. This helps to more accurately predict the position of the rotor, based on the loads applied, and provides a more accurate shaft-end relative displacement computation. Modeling details are shown in Fig. 25.
 |
|
FIG. 24. Rotor modeling. |
 |
|
FIG. 25. Details of FEA modeling: keel block and pedestals. |
 |
|
FIG. 26. Details of lube oil console modeling. |
A typical lube oil console model is shown in Fig. 26. Lumped masses are included to represent the weight of the oil. These lumped masses are attached at appropriate locations on the lube oil console FEA model. Some initial welded-in lube oil consoles have been found to add to the torsional rigidity of the base; however, analyses indicated that this additional rigidity was not required. Bolted-in lube oil consoles are a better design, as they eliminate the need to evaluate the thermal stresses between the lube oil console and the base beams.
Meshing of the base beams, torque box or torque tube, gussets, plates, deck plate and pedestals is achieved with shell elements that are assigned the proper plate thickness. The base beams may also be modeled with beam-type elements; however, modeling with base beam elements is considered to be somewhat less accurate due to the difficulty in adequately connecting the beam elements to the equipment pedestals. One advantage of using beam elements is that the beam axial and bending stresses can be easily extracted and compared to those outlined in the American Institute of Steel Construction Manual (2005) or similar criteria.
Densities are adjusted so that compressor, gear and motor analytical model weights equal the weights on the outline drawing. Additionally, checks must be made to ensure that the centers of gravity of the major equipment in the FEA model accurately represent the center of gravity on the outline drawing.
The lifting lugs should be modeled, and a lifting evaluation of the entire base should be performed. However, the lifting lugs are always rated in a separate analysis, where more detailed analytical models representing the plates, pipes, welds and bolts associated with the lifting lug are used. Hand calculations and FEA are used to evaluate the lifting lug. The stress criteria3 must be satisfied for the lugs. The total package load plus the weight of the shipping box must not exceed the rated lifting lug load.
Data gathering. A significant amount of information is required for the analyses. Work to assemble this information is initiated when the order is procured and continues through the analysis phase. For all FPSO projects, FEA load cases must be run with preliminary estimates of certain data, as discussed for the anti-vibration mounts (AVM) stiffness values in Part 1.
Thermal growth calculations and final motor and gear drawings (including motor and gear rotor details) are typically obtained after the start of the analysis phase. The ship deck stiffness is typically unavailable until near the end of the analysis. Coupling designs (which affect the shaft-end displacement criteria) are finalized during the analysis. Stress and displacements resulting from preliminary runs (which use preliminary data) provide important information on the sufficiency of the design and whether base design changes are required. The preliminary analysis runs also allow the determination of the worst-case load conditions, which is a significant effort.
Near the end of the analysis phase, when all final information is available, the worst-case load conditions are rerun to ensure that the final stresses and displacements are acceptable. Typically, these final results do not deviate more than a few percent from the preliminary results, making the value of starting the design and analysis with preliminary data apparent.
Typical data and information required for the analysis are as follows:
- Compressor, gear and motor rotor weights and rotordynamic input, including bearing stiffness
- Hand calculations of compressor and motor-side thermal growth
- Ship deck and AVM stiffness
- Maximum continuous parallel offset (MCPO) for high- and low-speed couplings
- Base and outline drawings
- Client specifications for wind loading and accelerations due to pitch and roll, and special requirements on load cases or load case combinations
- Material properties and strengths
- Horsepower, speed and shutdown vibration
- Compressor flange load information.
All required information and sources are documented continuously in the process.
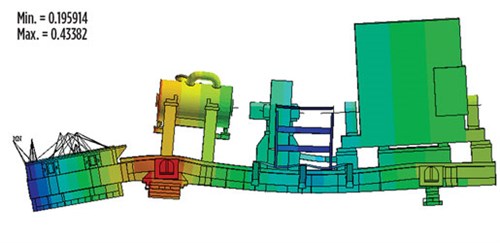
Loads, load case requirements and criteria. The lift of the entire base package is analyzed by simulating the constraints from the chain at a 60° angle from the horizontal and applying the acceleration due to gravity to the base package. A resulting displacement plot for one base package is shown in Fig. 27. The stress results on the base beams and plates are evaluated per the criteria.4 The lifting lugs and associated pipe, welds and bolts are evaluated separately using more detailed analytical models, as previously explained.
 |
|
FIG. 27. Lifting evaluation of a base package. |
 |
|
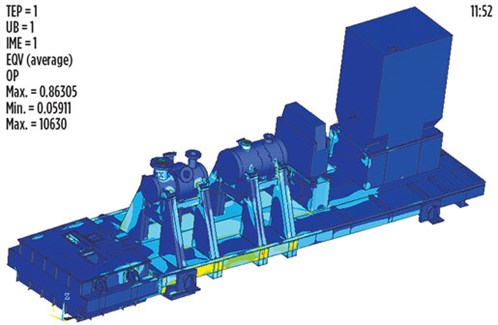
FIG. 28. Von Mises stress contour of a base package under operational loads. |
Occasionally, clients will provide compressor flange (nozzle) load cases for evaluation. These cases typically include from 5–50 separate nozzle load combinations. If nozzle loads specific to the contract are not provided, then the worst-case combination of nozzle loads that satisfies the 3Fr + Mr limit for each compressor nozzle and the 2Fc + Mc limit for all nozzles3 is determined. There are three translational loads and three moments on each nozzle. Each of these loads is run independently in the FEA. If the compressor has two nozzles, the FEA has 12 runs. If the compressor has four nozzles, it has 24 runs.
For each run, the shaft-end relative displacement between the compressor and the high-speed gear shaft, and the shaft-end relative displacement between the driver and the low-speed gear shaft, are determined. The FEA displacement results are entered into the spreadsheet, and linear elastic superposition is used to determine the shaft-end relative displacement for any combination of nozzle loads. All possible loading combinations on all possible nozzles are evaluated to identify the case with the largest shaft-end relative displacement. The nozzle load combinations that result in the highest shaft-end relative displacements are used with other loads for the operational load case evaluations.
The normal operating load cases consider dead weight, acceleration from FPSO vessel pitch, roll and heave, shutdown unbalance, torque, wind and worst-case nozzle loads. All of these loads (except for the dead loads) are run individually, and the shaft-end relative displacements are determined. Linear elastic superposition is again used to find the combination of loads that results in the highest shaft-end relative displacement. The worst cases usually entail all loads acting in the same direction, but there may be exceptions. The worst-case loads are determined based on shaft-end displacement rather than on stress. Base package design changes are almost always due to shaft-end displacement limitations rather than stress limitations. Once the worst-case combination of loads is determined, the following cases are run:
- Nozzle + acceleration + unbalance + torque + axial wind + dead loads
- Nozzle + acceleration + unbalance + torque + lateral wind + dead loads
- Nozzle + acceleration + unbalance + torque + axial wind
- Nozzle + acceleration + unbalance + torque + lateral wind.
 |
|
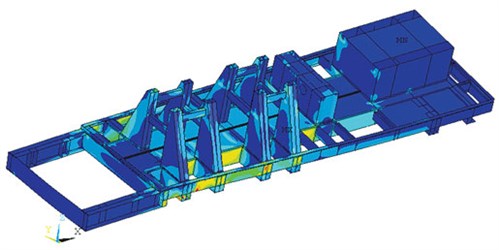
FIG. 29. Von Mises stress contour of a base only. |
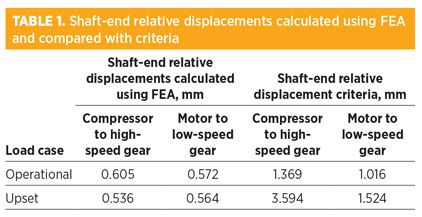
Cases 1 and 2, which include dead loads, are used to evaluate stresses. The only difference in these cases is the wind direction (axial or lateral). Examples of stress results are shown in Fig. 28 and Fig. 29. Typically, bulk average stresses are low and well within the criteria stresses. Cases 3 and 4 are the same as Cases 1 and 2, respectively, except that they do not include dead loads. Cases 3 and 4 are used to evaluate shaft-end relative displacements. Note: Dead loads should not be included when evaluating shaft-end relative displacements, since the shafts are aligned in the dead load condition. The shaft-end relative displacements must be within the coupling capability criteria, which is a prescribed percentage of the coupling maximum continuous parallel offset (MCPO), with an adjustment for thermal growth, if needed. The percentage is more stringent for compressor-to-gear coupling due to the higher speed. Table 1 shows typical shaft-end relative displacement results vs. criteria.
 |
Since the base beams are typically modeled with shell elements as opposed to beam elements, beam axial stresses and bending moments cannot be easily extracted for comparison to criteria in the American Institute of Steel Construction (AISC) Steel Construction Manual.5 Therefore, a stress criterion was developed that limits bulk average stresses on the base beams and pedestals to a fraction of the yield strength that is consistent with AISC criteria.
For the transportation analyses, the X, Y and Z acceleration loads, dead loads, axial wind loads and lateral wind loads are applied simultaneously in a combination that will result in the worst-case stresses. The acceptable stress criteria are the same as those used for the operational load cases.
A number of upset load cases may be required:
- Motor short-circuit torque
- FPSO survival (extreme) acceleration loading with survival lateral wind
- FPSO survival (extreme) acceleration loading with survival axial wind.
For the survival cases, the shaft-end relative deflection criteria is relaxed considerably, since the equipment should be shut down during these extreme conditions. For all upset cases, the acceptable stress criteria are the same as those used for the operational load cases, although some customer specifications may allow higher stresses.
Blast analysis and evaluation. Blast load analysis is often required for offshore. Blast loads may be applied as an equivalent static pressure, and blast load amplitudes from 0.08 bar to 0.8 bar have been requested. For any blast load amplitude, evaluations are performed for the longitudinal, transverse and vertical directions. Some permanent deformation of the base structural members is permissible, provided it can be demonstrated that the base will not be driven into the deck. Therefore, stresses in the bulk of the structural members should be below the minimum material yield stress, although some permanent residual deformation is allowable, provided the ship deck is not affected.
 |
|
FIG. 30. Von Mises stress contour resulting from vertical blast load. |
Fig. 30 shows a stress contour plot resulting from a vertical blast. Contours are set so that stress above the minimum yield strength is shown in gray. For this package, only localized areas near the top of the lube oil console exceeded the minimum yield strength. The total loads on the AVMs resulting from the blast must not be greater than 3 × the loads used to the design the AVMs. For the vertical blast case shown in Fig. 30, the AVM loading was, at most, 2.7 × the AVM design load.
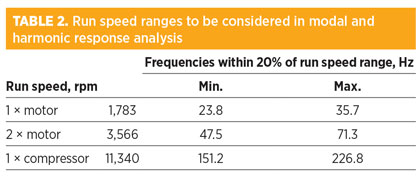
Modal analysis and evaluation. Frequencies and mode shapes are calculated through 120% of the compressor design speed. The analysis will typically identify hundreds of frequencies and associated mode shapes. Major modes (modes where the entire base moves) must be outside of the driver and compressor speed ranges by at least 20%. These major modes have high modal effective mass.
 |
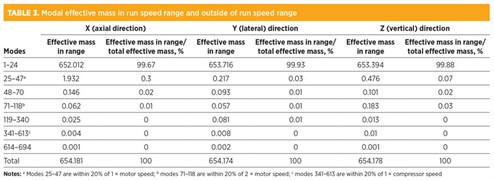 |
Table 2 and Table 3 show results for a typical FPSO base package design. The motor and compressor run speeds are documented in Table 2, along with the corresponding frequencies within 20% of these speeds. For this case, 694 frequencies were calculated within the analysis speed range. Table 3 shows that 24 of these modes were lower than 0.8 × the motor run speed range. These 24 modes accounted for 99.67%, 99.93% and 99.88% of the total modal effective mass of all modes in the axial (longitudinal), lateral (athwart-ship) and vertical directions, respectively. Therefore, the requirement for major modes to be out of the run speed range is satisfied.
 |
|
FIG. 31. Primary rocking mode about longitudinal axis. |
 |
|
FIG. 32. Primary rocking mode about athwart ship (lateral) axis. |
 |
|
FIG. 33. Primary vertical mode with entire package moving vertically. |
Mode 1 is shown in Fig. 31. This mode, which exhibits rocking about the longitudinal axis, has the highest modal effective mass in the athwart-ship direction. Mode 3 in Fig. 32 shows both sliding of the base in the longitudinal direction and rocking about the athwart-ship axis. This mode has the highest modal effective mass in the longitudinal direction. Fig. 33 shows Mode 6, which is associated with vertical motion of the entire base. Table 3 shows that modes 25–47 are within 20% of 1 × the motor speed. These modes account for only 0.3%, 0.03% and 0.07% of the total effective mass in the X, Y and Z directions, respectively.
There are 48 modes within 20% of the 2 × motor run speed range, and 273 modes within 20% of the 1 × compressor run speed range. These modes account for a very low percentage of the total effective mass, as shown in Table 3. Many of these higher modes are associated with the motion of a localized portion of the base; therefore, the effective masses associated with these modes are small.
 |
|
FIG. 34. Location at base of major equipment where vibration amplitudes are calculated. |
Equipment vibration amplitude calculation and acceptance criteria. A harmonic response analysis is performed to ensure that modes in the run speed range, although of small effective mass, do not result in unacceptable vibration at the feet of the major equipment. The typical locations monitored are shown in Fig. 34. These include the four corners of the motor base (1–4), two locations at the base of the gear (5, 6) and the four compressor feet (7–10). Appropriate multiples of mid-span unbalance, per API, are applied to the mid-span of the compressor, gear and driver rotor models. Both the real and imaginary portions of the loading are defined to simulate the rotating unbalance load on each rotor. The imaginary component has a 90° phase shift with respect to the real component.
 |
|
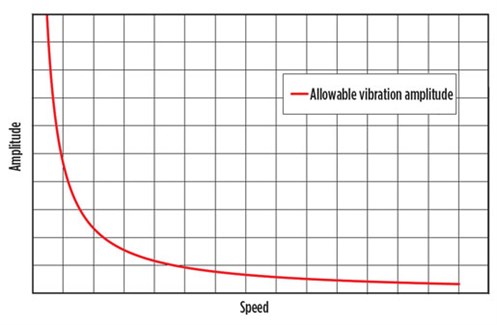
FIG. 35. Allowable vibration amplitude. |
 |
|
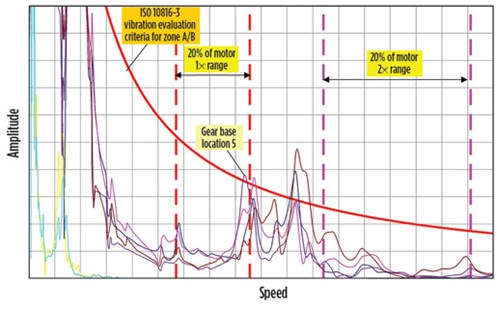
FIG. 36. Calculated amplitude of vibration versus criteria for one times and 2 Å~ motor speed. |
 |
|
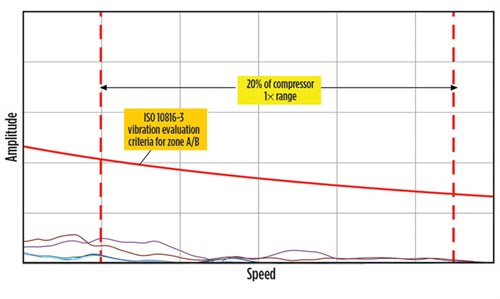
FIG. 37. Calculated amplitude of vibration vs. criteria for 1 Å~ compressor speed. |
The allowable amplitude of vibration6 is plotted vs. speed in Fig. 35. Typical plots of resulting amplitudes of vibration vs. speed are shown in Fig. 36 and Fig. 37. Fig. 36 shows the results for 1 × and 2 × motor run speed range. One location at the base of the gear was marginally above the criteria line. This was judged to be acceptable because it was very close to the upper 20% of the range. Additionally, damping was not included, making the results conservative.
Fig. 37 shows the results for 1 × compressor run speed range. All amplitudes for all locations monitored were significantly below the criteria line. These results further demonstrate that the 273 modes in this range are insignificant.
Design changes. When criteria are not met, plots of FEA model deformations, including animations of these displacements, are helpful in determining where changes are required. These design changes are typically made during the analysis phase and rarely need to be made due to stress considerations. Multiple bases were modified as a result of shaft-end relative displacement criteria. These modifications included:
- Swapping of AVMs to include two under the compressor
- Increased stiffness of torque box and torque tube
- Welding of beams to the side of a torque box
- Cross-bracing of compressor to gear pedestals
- Cross-bracing of gear to motor pedestals
- Additional stiffening plates
- Thicker pedestal plates and gussets inside of pedestals
- More robust keel blocks
- Stiffening plates in base between the compressor and the gear
- Additional bracing of longer plates to reduce vibration
- Additional bracing on auxiliary equipment supports.
The cross-bracing options are effective, but may not always be an option because of interference with other equipment. They could also present a tripping hazard.
For all design modifications, the FEA model is rerun with the design modifications included to verify that criteria are met. As three-point mount designs have been conducted for a number of years, the design changes identified as a result of analyses have decreased significantly. Lessons have been learned as to what changes are most effective, and many of the design changes have been carried over to new contracts. Using larger wide-flange beams instead of torque boxes or torque tubes has been effective in increasing base stiffness. They add weight to the package, but can be a very attractive option. Using larger beams may eliminate the need for other design changes.
Additionally, since the larger, wide-flange beam designs do not require a torque box or a torque tube, the lube oil console can be included under the base rather than on the end of the base. Also, multiple torque tubes to accommodate an in-base lube oil console may not be needed. A shorter base package footprint is desirable on FPSOs, where space is a premium. The lessons learned do not minimize the need for analysis on new contracts, especially as the base package design continues to improve and evolve.
Reduction of analytical cycle time. FEA model development time has been shortened considerably. The largest time reduction has been in the shell element modeling of the wide-flange beams, pedestals and plates. This reduction was accomplished, with more efficient extraction of the mid-plane thickness and edge connections with joining plates, using proprietary design modeling software. The time required for data collection has been shortened, as has the time required to determine the worst-case combination of nozzle loads and operational loads, due to the highly efficient linear elastic superposition calculation. These improvements and automations have reduced total analysis time by at least 40%.
Takeaway. Worldwide distribution of FPSOs and typical applications have been discussed. The three AVMs dampen the response and isolate the base package from the FPSO deck. Three base designs have also been discussed. Torque box and torque tube designs provide torsional stiffness and result in lighter base packages. Larger I-beam designs are heavier, but provide higher torsional stiffness and allow for a shorter package by including the lube oil reservoir under the base. The shaft-end relative displacement criteria are more limiting than the stress criteria.
Significant detail is included in the FEA models to accurately calculate the shaft-end relative displacement. These details include more accurate modeling of the rotors, bearing connections, compressor pedestal sliding and keel blocks. The importance of initiating the analysis while using preliminary data is emphasized as the base manufacture and analysis phases are conducted concurrently. Base modifications that are identified early in the manufacturing cycle are much easier to implement than those identified later.
Improvements in data gathering, FEA model preparation and the automation of worst-case load combinations have resulted in a 40% reduction in analysis time. The analytical models provide a valuable tool for assessing the suitability of three-point base package design for FPSOs.
End of series. Part 1 appeared in the September/October 2017 issue of Gas Processing. GP
Literature cited
3. “Axial and centrifugal and expander compressors for petroleum, chemical and gas industry services,” American Petroleum Institute (API), API 617, 7th Ed., July 2002.
4. “Design of below-the-hook lifting devices,” American Society of Mechanical Engineers (ASME), ASME BTH-1-2011, April 2012.
5. American Institute of Steel Construction (AISC), Steel Construction Manual, 13th Ed., 2005.
6. International Standards Organization, “Mechanical vibration: Evaluation of machine vibration by measurements on non-rotating parts—Part 3: Industrial machines with nominal power above 15 KW and nominal speeds between 120 r/min and 15,000 r/min when measured in situ,” ISO 10816-3:1998(E), 1st Ed., May 1998.
 |
Edward Abraham is Principal Solid Mechanics Engineer for the Dresser-Rand business, which is part of Siemens Power & Gas. He has performed numerous analyses of turbomachinery components, including cases, impellers, lifters, rotors and base packages.
 |
Harry Miller is Director of Emerging Technology for the Dresser-Rand business. He has authored several technical papers and articles, has been awarded and has contributed
to several patents, and has received the Dresser Industries Annual Technical Achievement Award. He is also a member of the American Society of Mechanical Engineers.


Comments