
Process selection and recent design innovations for LNG plants—Part 1
I. S. Al-Mutaz, I. Wazeer and R. Khan, King Saud University, Riyadh, Saudi Arabia; and
A. Chafidz, State University of Semarang, Semarang, Indonesia
Global LNG demand is increasing rapidly because natural gas is considered to be the cleanest-burning fossil fuel. Other features of LNG include low carbon dioxide (CO2) emissions, ease of transport, sustainable development and energy security.
Different types of natural gas liquefaction plants have been developed globally to meet rising demand for LNG. The selection of LNG technology involves parameters such as equipment (e.g., compressors, turbines, heat exchangers, etc.) and process definitions (e.g., pressure levels, temperature range, type of refrigerant, etc.).
However, LNG technologies are cost-intensive, as they require a large amount of energy for the processes of compression and refrigeration. Therefore, further developments are required to save costs and improve the efficiency of existing gas liquefaction processes.
Here, a preview is given of aspects related to the theory of the technology, and the parametric study of LNG plants and their development. Existing and future traits of LNG processes are analyzed in view of recently constructed plants.
LNG gaining ground as gas demand soars. Energy plays a prominent role in the quality of human life, in terms of both manufacturing and services.1,2,3 Natural gas is becoming a dominant source of energy in several countries around the world.4,5,6
The transportation of natural gas has been carried out safely and economically via pipeline for almost a decade. However, in the twenty-first century, it has become clear that the majority of new gas reserves are difficult to locate. The latest developments in gas exploration and extraction have been aimed at stranded reservoirs that were considered too distant, costly or challenging to develop in the past.7,8
Among the different solutions for exploiting stranded gas reserves, gas liquefaction9,10,11 has helped bring large, remote gas fields to market over the past few decades. These distant gas fields are often unreachable by pipeline.12 Long-distance transportation of LNG is possible by ship and truck due to the physical properties of gas in its liquid form. LNG can also be stored in places where geological circumstances are not appropriate for developing underground storage service.
However, the costs of building an LNG production terminal are higher compared to other energy projects due to a number of factors, including safety considerations, remote construction areas, stringent design specifications and large quantities of cryogenic material. Developments in LNG technology have reduced project costs in recent years.7,13
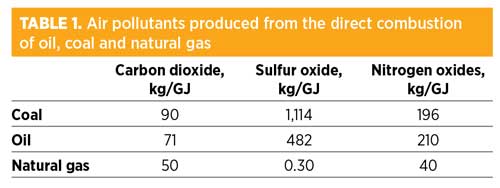
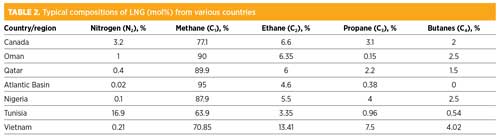
Emissions of air pollutants from the direct combustion of oil and coal are significantly higher compared to that of natural gas, as shown in Table 1.14,15 The LNG industry becomes competitive to gas pipelines and other transport alternatives because it offers flexibility, attractive economics and security of supply. The composition of LNG depends on the source of the feedstock gas. LNG composition includes methane and other higher hydrocarbons, sulfur, nitrogen and carbon dioxide. The typical compositions of LNG from different countries are listed in Table 2.7,16 LNG is a clean source of energy because its combustion products contain trace amounts of nitrogen oxides and almost no sulfur oxides. LNG has standards, codes and regulations that ensure excellent safety and security.
 |
 |
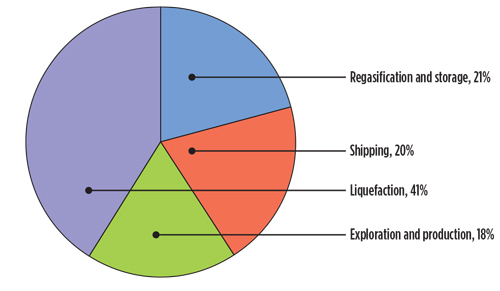
Many complex and expensive LNG energy projects are underway around the world. The LNG value train consists of a set of unique values. For each component in the LNG value train, the percentages of average capital costs are shown in Fig. 1.14 A major portion of the cost is occupied by the liquefaction plant, accounting for almost 41% of the total cost. All other components comprise smaller, but still substantial, cost amounts.
|
Fig. 1. Percentage of average capital costs of different components of the LNG value train. |
 |
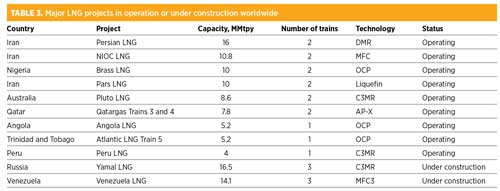
The production capacity of many LNG plants in operation or under construction15,17,18,19 (Table 3) surpasses 6 Mtpy of LNG. Several developments have been made in the LNG industry to reduce energy consumption.20
 |
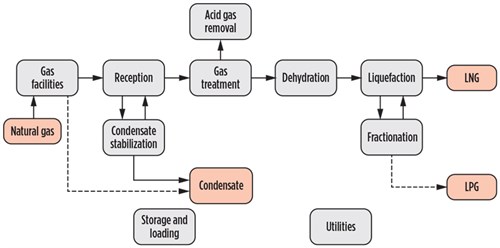
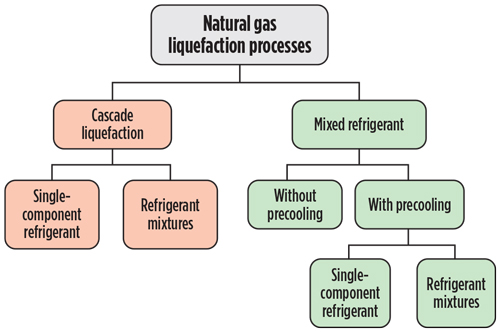
LNG process and technology. A simplified LNG schematic, including process units and utilities, is shown in Fig. 2. Liquefaction technologies are classified on the bases of refrigeration cycles—i.e., open-cycle processes and closed-cycle processes, as shown in Fig. 3. In an open-cycle process, the refrigerant may be part of the natural gas feed. In the closed-cycle process, the fluid refrigerant is separately supplied and recirculated through the liquefier or heat exchanger. The refrigerant feed can be single or mixed. Gas liquefaction processes are differentiated mainly by the type of refrigeration cycle employed.
|
Fig. 2. LNG block flow diagram. |
 |
Here, the most common onshore gas liquefaction technologies that have been successfully operated in land-based liquefaction plants are discussed. A brief description of these technologies is outlined in Fig. 3.
|
Fig. 3. Classification of gas liquefaction processes. |
 |
Propane precooled MR process (C3MR). The C3MR process involves a precooling cycle that uses a single-component refrigerant (propane) and a liquefaction subcooling cycle operated with a mixed refrigerant (MR). A process flow diagram is shown in Fig. 4.
|
Fig. 4. Process schematic for the C3MR liquefaction process. |
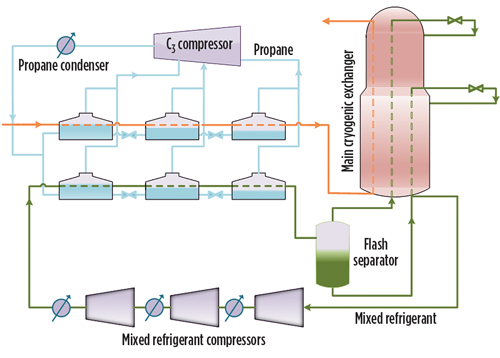 |
During the precooling stage, the refrigeration cycle is applied in multistages at different pressures to cool both the gas stream and the warm MR to approximately –35°C.21 The fluid circulation continues with a multistage compressor, which compresses the vapor propane from a different pressure level to a constant outlet pressure. The heat exchange continues until the propane stream becomes liquid in the condenser. After condensation, the propane stream is throttled many times throughout the precooling heat exchanger networks to vaporize it again.
In the liquefaction subcooling cycle, the temperature of the natural gas is further reduced from –35°C to approximately –160°C. A flash separator separates the partially condensed MR during the precooling cycle into vapor and liquid. Both streams are passed through the main cryogenic heat exchanger. The liquid stream is removed in the first section and recirculated through the shell side, while the gas stream goes all the way through both sections/bundles. It is throttled at the top and recirculated on the shell side in the same way. Prior to the compression process, both streams are mixed again, and then vaporized. The compression is carried out with a two- or three-compressor arrangement, followed by intercooling.22
Mixed-fluid cascade (MFC) process. In the MFC process, three MRs are used to execute the precooling, liquefaction and subcooling steps. A multistream heat exchanger arrangement is used for the three cycles. In the precooling cycle, the natural gas stream, liquefaction and subcooling refrigerant are cooled to approximately –50°C. Both the natural gas stream and the subcooling-stage MR are cooled during the liquefaction cycle. A typical MFC process flow diagram is shown in Fig. 5. Precooling is carried out in a plate-fin heat exchanger (PFHE) by the first MR, and the liquefaction and subcooling are carried out in a spiral-wound HE (SWHE) by the other two refrigerants.
|
Fig. 5. Process schematic for the MFC liquefaction process. |
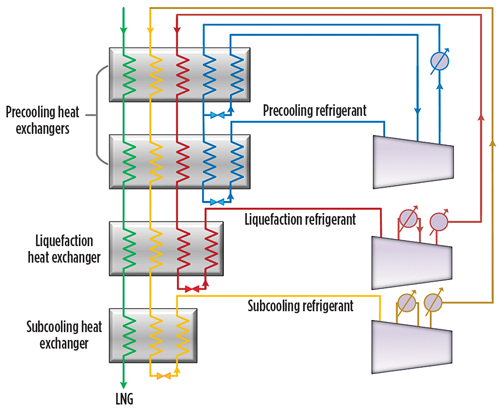 |
In both heat exchangers, the precooling MR vaporizes and is used to cool the warm side streams. The vaporized streams are compressed for liquefaction in the precooling condenser. The precooling process is followed by the liquefaction process, where the liquefaction MR is further cooled by throttling on the cold side. The cooled stream vaporizes when used as a cold side in the liquefaction HE, and the warm side streams are cooled. The vaporized, cooled refrigerant is then compressed for liquefaction and cooled by the liquefaction cooler. The liquefaction MR recycles in the precooling HE.
The cooling MR enters the subcooling HE after passing through the precooling and liquefaction stages. As in the previous stages, the throttled side vaporizes and the warm side streams cool down. The refrigerant is sent to the subcooling compressor, where it is again compressed, cooled via subcooling and sent back to the precooling and liquefaction process. All cycles require more than one compressor and intercooler.
Optimized cascade process. The optimized cascade process (OCP) is a simple and reliable technology. A process flow diagram for the OCP is shown in Fig. 6. In this process, three pure-component refrigerants (namely propane, ethane and methane) are used at different pressures during the refrigeration and liquefaction processes. Centrifugal compressors are used for the circulation of these refrigerants, and cooled within a series of brazed aluminum vertical cold boxes. The power is supplied through Frame 5 gas turbines.
|
Fig. 6. Process schematic for the OCP liquefaction process. |
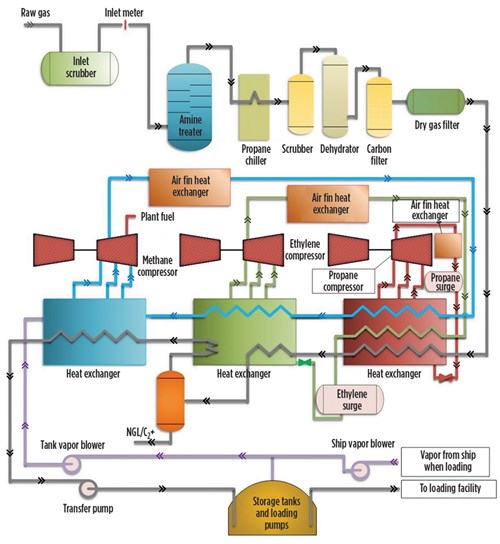 |
For both the precooling cycle and the MR cycle, two gas turbine drivers (30-MW Frame 5) are normally used. Each train contains two compressors that operate at 50% capacity to achieve low operating cost and high plant availability.
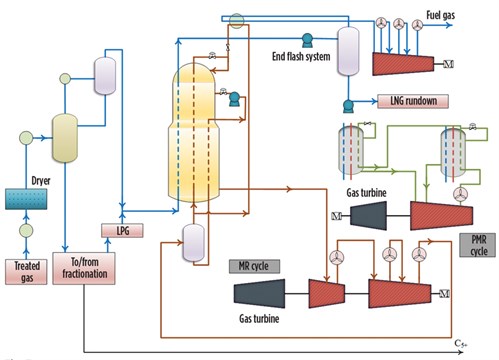
Dual MR process. The dual MR (DMR) process has been used for train capacities averaging 4.8 Mtpy. The process configuration is similar to the propane precooled MR process, with precooling requiring a mixture of ethane and propane, rather than pure propane. SWHEs are used for precooling. Frame 7 gas turbines are responsible for driving the refrigerant and axial compressors. For compression of cold refrigerant, axial compressors are used during the compression stages.
The DMR process uses parallel compressor trains for each process stream and can be operated with both PFHEs and SWHEs. A process flow diagram for a DMR process is shown in Fig. 7. This technology is useful for large-scale capacities of 5 MMtpy–8 MMtpy.
|
Fig. 7. Simplified process schematic for the DMR liquefaction process. |
 |
Equipment selection: Part 2. The next installment of this article, slated to appear in the May/June 2017 issue, will examine equipment and technology selection for different sizes and types of LNG terminals. GP
Acknowledgment
The authors extend their sincere appreciation to the Deanship of Scientific Research at King Saud University for its funding of this research through Research Group Project number RGP-224.
Literature cited
- Sönmez, E., S. Kekre, A. Scheller-Wolf and N. Secomandi, “Strategic analysis of technology and capacity investments in the liquefied natural gas industry,” European Journal of Operational Research, Vol. 226, April 2013.
- Neseli, M. A., O. Ozgener and L. Ozgener, “Energy and exergy analysis of electricity generation from natural gas pressure reducing stations,” Energy Conversion and Management, Vol. 93, March 2015.
- Chong, Z. R., S. H. B. Yang, P. Babu, P. Linga and X.-S. Li, “Review of natural gas hydrates as an energy resource: Prospects and challenges,” Applied Energy, Vol. 162, January 2016.
- Geman, H., Commodities and Commodity Derivatives: Modeling and Pricing for Agriculturals, Metals and Energy, John Wiley & Sons, Hoboken, New Jersey, 2009.
- Dorian, J. P., H. T. Franssen and D. R. Simbeck, “Global challenges in energy,” Energy Policy, Vol. 34, October 2006.
- Zhao, J., Z. Zhu, Y. Song, W. Liu, Y. Zhang and D. Wang, “Analyzing the process of gas production for natural gas hydrate using depressurization,” Applied Energy, Vol. 142, March 2015.
- Mokhatab, S., J. Y. Mak, J. V. Valappil and D. A. Wood, Handbook of Liquefied Natural Gas, Elsevier, Amsterdam, The Netherlands, 2013.
- Thackeray, F. and G. Leckie, “Stranded gas: A vital resource,” Petroleum Economist, Vol. 69, May 2002.
- Bahadori, A., Natural Gas Processing: Technology and Engineering Design, Elsevier, Amsterdam, The Netherlands, 2014.
- Lin, W., N. Zhang and A. Gu, “LNG (liquefied natural gas): A necessary part in China’s future energy infrastructure,” Energy, Vol. 35, November 2010.
- Foss, M. M., F. Delano, G. Gulen and R. Makaryan, “LNG safety and security,” Center for Energy Economics (CEE), 2003.
- Tusiani, M. D. and G. Shearer, LNG: A Nontechnical Guide, PennWell, Tulsa, Oklahoma, 2007.
- Cornot-Gandolphe, S., O. Appert, R. Dickel, M.-F. Chabrelie and A. Rojey, “The challenges of further cost reductions for new supply options (pipeline, LNG, GTL),” 22nd World Gas Conference, Tokyo, Japan, 2003.
- Lim, W., K. Choi and I. Moon, “Current status and perspectives of liquefied natural gas (LNG) plant design,” Industrial & Engineering Chemistry Research, Vol. 52, March 2013.
- Ikealumba, W. C. and H. Wu, “Some recent advances in liquefied natural gas (LNG) production, spill, dispersion and safety,” Energy & Fuels, Vol. 28, June 2014.
- Kidnay, A. J. and W. R. Parrish, Fundamentals of Natural Gas Processing, CRC Press, Boca Raton, Florida, 2006.
- Castillo, L., R. Nadales, C. González, C. Dorao and A. Viloria, “Technology selection for liquefied natural gas (LNG) on base-load plants,” XIX International Gas Convention, Caracas, Venezuela, 2010.
- Humphrey, G., “Current state and outlook for the LNG industry,” Rice University Global E&C Forum, Houston, Texas, 2011.
- Prasetyo, N. H., “Maintaining excellence in a declining production,” IGT International Liquefied Natural Gas Conference Proceedings, 2013.
- Castillo, L. and C. A. Dorao, “Influence of the plot area in an economical analysis for selecting small scale LNG technologies for remote gas production,” Journal of Natural Gas Science and Engineering, Vol. 2, December 2010.
- Wang, M., J. Zhang and Q. Xu, “Optimal design and operation of a C3MR refrigeration system for natural gas liquefaction,” Computers & Chemical Engineering, Vol. 39, June 2012.
- Pillarella, M., Y.-N. Liu, J. Petrowski and R. Bower, “The C3MR liquefaction cycle: Versatility for a fast growing, ever changing LNG industry,” Proceedings of the 15th International Conference and Exhibition on Liquefied Natural Gas, Barcelona, Spain, 2007.
 |
Ibrahim S. Al-Mutaz is a Professor of chemical engineering at King Saud University in Riyadh, Saudi Arabia. His expertise lies in process engineering, process plant troubleshooting and rehabilitation, process equipment, process plant performance and efficiency, process technology, simulation and optimization of desalination processes, desalination and water treatment, optimum production of water and power, groundwater pretreatment facilities and environmental protection. He has published approximately 200 papers in journals and conferences, as well as 13 books. Dr. Al-Mutaz earned his BSc degree in chemical engineering from King Saud University in Riyadh, Saudi Arabia. He earned his PhD in chemical engineering from Yale University in New Haven, Connecticut.
 |
Irfan Wazeer is a Researcher in the chemical engineering department at King Saud University. His research interests center on the applications of ionic liquids and deep eutectic solvents. He has also been involved in projects for water desalination, natural gas processing and liquid-liquid extraction. He earned his BSc degree in chemical engineering from the University of Engineering and Technology in Lahore, Pakistan. He was also awarded a fully funded scholarship from Saudi Arabia’s Ministry of Higher Education to attend King Saud University, where he earned his MSc degree in chemical engineering.
 |
Rawaiz Khan is a Researcher in the chemical engineering department at King Saud University. He graduated from Hamdard University in Karachi, Pakistan in 2009. In 2012, he joined King Saud University as a Research Scholar on a fully funded scholarship offered by Saudi Arabia’s Ministry of Higher Education, under the Attracting Outstanding Faculty and Researchers Program. He completed his MS degree in chemical engineering at King Saud University in 2015. He has also worked in the petrochemical industries of Pakistan and the UAE.
 |
Achmad Chafidz Mas Sahid is a Lecturer in the chemical engineering department at the State University of Semarang in Semarang, Indonesia. Previously, he worked as a Researcher at the SABIC Polymer Research Center at King Saud University. His research areas include processing and characterization of polymer nanocomposites; application of supercritical CO2 fluid in the pharmaceuticals industry; development of portable, solar-powered membrane distillation systems for remote areas; and development of flotation reagents for Saudi phosphate ores. He received his BSc degree in chemical engineering from the Sepuluh Nopember Institute of Technology in Surabaya, Indonesia in 2007. He earned his MSc degree in chemical engineering from King Saud University in 2011. He has also published several papers in industry journals.


Comments