
Optimize an integrated natural gas production and distribution network
D. Aluma and N. Thijssen, Shell International Exploration and Production, The Hague,
The Netherlands; K. M. Nauta and C. C. Pantelides, Process Systems Enterprise Ltd., London, UK; and N. Shah, Imperial College London, London, UK
Gathering significant volumes of natural gas usually involves connecting to wells in different oil and/or gas fields that can be spread across vast geographical areas. Supplying processed gas and associated liquids, such as LPG and NGL, to consumers often requires an extensive network of degassing stations, compressor stations, pipelines and gas processing plants, as well as storage facilities and shipping terminals for the liquids.
Natural gas networks have peculiar characteristics that complicate supply chain management. For example, there is usually no intermediates storage. For associated natural gas, it is generally impossible to curtail well production, as this leads to loss of oil revenue. Therefore, a drop in consumer gas demand or an outage in the gas network typically results in significant gas flaring. The penalty for a constrained or inefficient gas network is environmentally and economically severe, more so than for liquids- or solids-based process networks.
The use of network modeling and optimization technologies for strategic decision-making yields substantial benefits, not only in economic and environmental terms but also in an improved understanding of the interaction between the various components of the process and the overall business.1 Key benefits of the application of systematic optimization to natural gas network production include:
- Increased profitability: Given the tight market conditions, even small improvements in the gas supply chain can have an impact on profitability, and could be critical to long-term business viability.
- Improved reliability: A network optimizer provides a tool that can be used, for example, to rapidly reallocate production upon equipment failure to satisfy customers and honor contractual delivery commitments.
- Investment planning: Comprehensive network models can be used to gain insights into network bottlenecks and to enable planning for debottlenecking or expansion projects.
- Flare reduction: Network optimization techniques can be used to minimize environmental and economic penalties from inefficient operations.
Even greater benefits can be realized by considering multiple production periods through the simultaneous optimization of production, sales and inventory over consecutive time periods, with demands, prices and costs varying across periods.
APPROACHES TO SUPPLY NETWORK OPTIMIZATION
Conventional approaches to the optimization of large supply networks tend to rely on simple models of the individual nodes (e.g., production facilities and processing plants) in these networks, often taking the form of simple (frequently linear) relations between the flowrates of the various materials entering and leaving each node.
While this greatly simplifies the solution of the underlying mathematical optimization problem, it may be problematic in important ways. In particular, the resulting solutions may not be implementable in practice, as they may exceed plant capabilities. This problem may be addressed by performing the optimization calculations in a conservative manner—for example, by introducing safety margins to ensure that the solution does not violate critical constraints. Alternatively, some appropriate adjustments may be applied, often at the local level of individual processing plants, a posteriori to the “optimal” solution to restore the feasibility of any constraints that it violates. However, such pragmatic adjustments almost always lead to suboptimal solutions. Given the substantial revenue flows in such large networks, these solutions may translate into a significant loss of opportunity.
An alternative approach to natural gas supply chain optimization is to use a higher level of physical detail in describing the operation of the individual production and processing nodes, thereby ensuring that any obtained solution satisfies all important constraints on the operation of plant equipment.
Until recently, this approach was considered to be impractical because of two significant obstacles. First, the construction of detailed models for the individual plants is a non-trivial exercise. Secondly, the resulting optimization problem was often outside the capabilities of existing numerical solvers.
However, detailed mathematical modeling is increasingly being used for the simulation and optimization of individual plants, which means that the required plant models are already available in many cases. Also, the continual evolution of computer hardware and process modeling technology is now bringing the solution of models of the required size within the scope of the available tools.
A key development in this context has been the significant progress made over the past decade by equation-oriented process modeling frameworks.2 These frameworks now allow large-scale models, comprising fairly detailed, smaller models of individual equipment items within wide system envelopes, to be constructed and reliably solved with minimal user intervention. Moreover, coupling these models with rigorous mathematical optimization solvers allows the effective and efficient exploration of decision spaces spanning large numbers of decision variables. In practical terms, it is now possible to perform the optimization of models comprising several hundreds of thousands of nonlinear equations that are subject to dozens of decision variables.
INTEGRATED NATURAL GAS PRODUCTION AND PROCESSING NETWORKS
The technological developments outlined in the previous section, coupled with improving process knowledge and developments in the global natural gas industry, are now driving rapid innovation in natural gas/NGL supply chain modeling and optimization. This work describes how detailed models of such networks are used to optimize profitability, as well as other business objectives, creating significant economic benefit without the need for additional CAPEX.
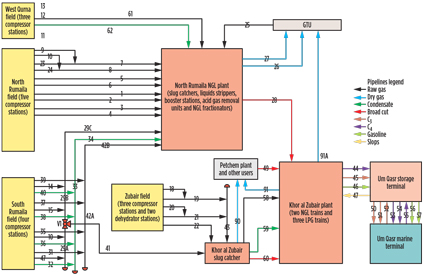
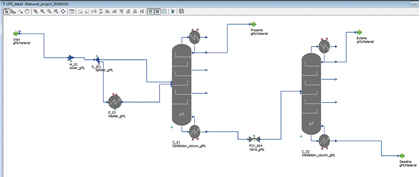
The natural gas network of Basrah Gas Co. (BGC)a is used as a case study. The BGC network in southern Iraq, shown schematically in Fig. 1, processes associated natural gas from four oilfields situated in West Qurna, North and South Rumaila and Zubair. BGC produces dry gas and LPG for the domestic Iraqi market. LPG and condensate are also exported after satisfying local demand.
 |
|
Fig. 1. BGC gas network schematic. |
At each oilfield, gas is received at different pressures following its separation from oil. The gas is then compressed at a number of compressor stations and transported via an extensive (650-km) pipeline network to an NGL processing plant at North Rumaila and to NGL and LPG plants at Khor al Zubair.
An important characteristic of the network is that gas from the South Rumaila field may be sent to either of the two processing locations, providing an additional degree of overall operational flexibility. Moreover, the two processing facilities are coupled via a broadcut liquid stream comprising propane, butane and gasoline, that is sent from the North Rumaila plant to Khor al Zubair for further processing.
Dry gas from both plants is introduced into the domestic Iraqi network via a gas transmission unit (GTU), while liquid products from Khor al Zubair are sent to the Um Qasr storage and marine terminals.
NETWORK MODEL
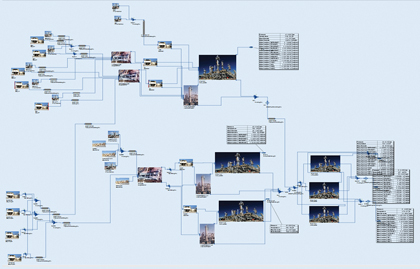
A detailed model of the BGC natural gas network was developed using a commercially available, equation-based process modeling and optimization tool. The model was constructed in a hierarchical manner, with models of the individual production and processing facilities embedded within a top-level model shown in Fig. 2. The unit operation models were taken from standard libraries supplied within the environment. The overall model comprises approximately 280,000 nonlinear equations.
 |
|
Fig. 2. BGC network model topology showing top-level models and their |
To provide suitable fidelity for optimization calculations, detailed pipeline models, compressor models with performance curves and multicomponent vapor-liquid-equilibrium (VLE) models were used throughout. Murphree tray efficiency was applied to the tray-by-tray distillation column to align predicted column performance with actual data from plant operations.
Component and mixture properties were supplied by the built-in physical property package, using the Peng-Robinson equation of state to describe
the pressure-volume-temperature (PVT) properties of the natural gas system.
To establish a reliable basis for the optimization studies, the network model was validated against operational data from the BGC network.
Compressor station modeling. Detailed steady-state models were implemented for the compressor stations, utilizing the actual compressor performance curves. Interpolation methods are used to determine polytropic head and efficiency from the flow data.
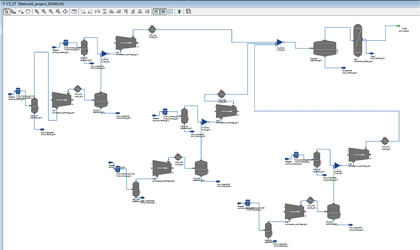
The compressor station models also contain air-cooled heat exchangers, vapor-liquid separators and a triethylene glycol (TEG) dehydration unit to meet the pipeline specification for H2O. The TEG unit was modeled as a simple component splitter to remove water from the compressed gas. Fig. 3 shows the model topology for a three-train compressor station.
 |
|
Fig. 3. Three-train compressor station model. |
Pipeline modeling. The pipelines are modeled using a distributed model to describe pressure drop in the line and heat transfer to surroundings. This level of detail is required to properly account for multiphase flow and liquid dropout in the extended pipeline system. Pressure drop is calculated based on the Haaland friction factor correlation, with appropriate corrections applied to account for pipeline bends, elevations and inline deposits.
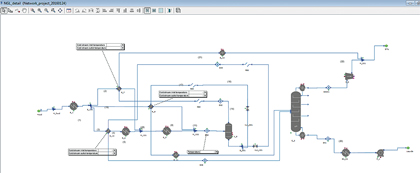
NGL plant modeling. The NGL plant comprises a slug catcher, gas booster units, an acid gas removal unit (AGRU), cooling loops, a low-temperature separator and a deethanizer. Detailed models were used for the cooling loops, low-temperature separator and deethanizer. The AGRU was not modeled, as the H2S treatment function does not significantly affect network flowrates and production.
Slug catchers. The slug catcher removes the transient slugs that develop in the pipeline and ensures a steady flow of gas to the NGL plant. The liquids that form in the pipeline as a result of ambient cooling are also removed. The operation is modeled as a simple flash drum affecting the necessary vapor/liquid separation.
Liquid stripper units. The liquid from the slug catcher goes to a liquid stripper unit, which causes any gas in the liquid to desorb, thereby increasing gas recovery while stabilizing the resulting liquid stream. The latter is pumped to broadcut storage, where it mixes with the broadcut (C3+) from the deethanizer bottoms.
The liquid stripper unit is modeled as a trayed column with a reboiler. The column model incorporates detailed phase equilibria.
Cooling loops and low-temperature separator. The gas cooling cycle was modeled in detail (Fig. 4). The cycle involves a number of recycle loops comprising chillers and heat exchangers for the integration of heat between the inlet and outlet streams of the low-temperature separator (LTS).
 |
|
Fig. 4. NGL plant model showing cooling cycles, LTS and deethanizer. |
After cooling to about –30°C, the fluid flows into the LTS, where it is flashed. The gas phase is dry gas (mostly methane), which is fed into the export grid after it is used to cool the inlet stream. The liquid phase from the LTS is also used to cool the inlet streams before flowing to the deethanizer fractionator.
Deethanizers. Dry gas (methane and ethane) is extracted from the top of the deethanizer distillation column while the C3+ is drawn from the bottom. An important constraint during network optimization is the avoidance of flooding in the various columns. Failure to take proper account of this constraint may result in significant over-estimation of the plant’s processing capacity. The authors’ optimization calculations required the actual vapor velocity to not exceed 85% of the flooding velocity, as determined via the fair correlation.
LPG PLANT MODELING
The LPG plant at Khor al Zubair comprises three parallel trains, each including depropanizer and debutanizer columns (Fig. 5).
 |
|
Fig. 5. LPG plant showing depropanizer and debutanizer columns. |
Each depropanizer receives two feeds (one with and one without reheating) of C3+ components from the NGL trains. A condensed, propane-rich stream is extracted from the top, while the C4+ components are drawn from the bottom and go to the corresponding debutanizer. The latter produces a butane-rich top product and a natural gasoline (C5+ components) bottom product. As in the case of the NGL plant deethanizers, flooding constraints were implemented in both columns.
The top products from the depropanizers in the three trains, and the top and bottom products from the debutanizers, are combined to form the propane, butane and gasoline product streams of the LPG plant.
OPERATIONAL OPTIMIZATION
A number of different operational optimization cases were studied. The full network model described in the previous section was used in each case, and the optimization was carried out with respect to 77 decision variables, including feed gas rates from oil production, gas-to-NGL plant splits, distillation column reflux ratios and column boilup ratios. The optimization also took account of 32 constraints, including product specifications and equipment limits.
The optimization studies were closely related to the business objectives listed in the beginning of this work, and covered both normal and abnormal operating scenarios.
Optimization under normal operating scenarios. Several normal operational scenarios were considered:
- Maximize operating profit, taking account of the values of the various products (dry gas, propane, butane and natural gasoline) based on market-driven contractual sales prices, as well as variable production costs, including raw gas and utilities (electricity, and heating and cooling utilities)
- Maximize total production (i.e., the total mass flowrate of all product streams), irrespective of any economic factors
- Maximize specific product yields (i.e., the ratio of that product’s mass flowrate divided by the overall mass flowrate of gas entering the system)
- Minimize flaring (i.e., the difference between the total mass flowrate of gas entering the system and that of all product streams).
The performance of the network under optimal operation was compared with that of a base point representing design operating conditions. The magnitudes of the resulting improvements in operation are listed in Table 1. Profitability optimization results in a potential 4.9% profit increase compared to the base case. A more detailed analysis of the results indicates that this increase arises largely from the optimized routing of raw gas from the different compressor stations to the two NGL plants and, to a lesser but significant extent, from applying optimal reflux and boilup ratios in the columns.
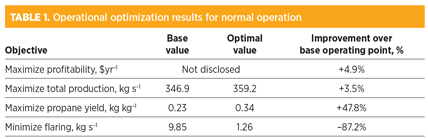
Significant improvements are also obtained under the other normal operating scenarios. In particular, there is scope to increase total production by 3.5%. Additionally, the results show that it is possible to increase the yield of a key product by nearly 50%, if required, and flaring can be reduced by 87% if this is posed as the primary objective.
Optimization under abnormal operating scenarios. The following “abnormal” scenarios were also considered:
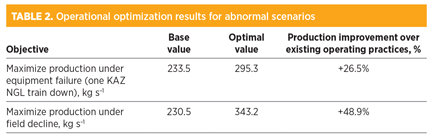
- Maximize production under equipment failure, resulting in the unavailability of one of the two NGL trains at the Khor al Zubair plant
- Maximize production under field decline, resulting in lower gas flowrates being received from the West Qurna field.
Table 2 compares the optimal production rates with base values representing the rates that would result from the above failure scenarios leading to deviation from normal design operation. The potential benefits from a rigorous mathematical optimization approach are even more pronounced than those under the normal scenarios shown in Table 1. In such cases, the optimizer provides a tool that can be used to significantly reduce the effects of abnormal situations on the network’s operation.
MULTI-PERIOD OPTIMIZATION OF NETWORK PROFITABILITY
The profitability maximization study considered in the previous section focused on a single operating period with given product prices and unit costs. The production rate for each product was assumed to be equal to its sales rate; therefore, the potential of building up product inventories, or of using existing inventories to support sales, was not considered.
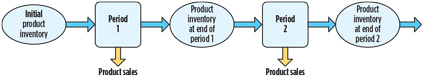
In this section, the simultaneous optimization of production, sales and inventory over consecutive time periods is considered, with demands, prices and costs potentially varying across periods. The goal is to maximize the overall profit for the entire time horizon by varying, in each period, the process operating variables, sales rates (subject to contractually committed levels and maximum market demands) and the inventory levels (subject to storage capacities). Overall, this multi-period optimization (MPO) problem, illustrated schematically in Fig. 6, aims to combine operational optimization with commercial planning using the full network model.
 |
|
Fig. 6. Multi-period optimization schematic. |
To illustrate the potential benefits of an MPO approach, a two-period problem is considered, with product prices in the second period being higher than in the first. The optimization makes use of a restricted subset of the decision variables, excluding the column reflux and boilup ratios. Limitations on product storage tank capacities are taken into account, as well as the constraints introduced in the previous section.
Table 3 compares network profitabilities achieved via 1) a base case operation, 2) application of the optimization approach described in the previous section to each of the two periods independently (“sequential optimization”), and 3) the MPO approach. It is evident that MPO results in significantly improved profitability (6.2% over the base case) compared with that achieved via the sequential application of even a sophisticated single-period optimization approach.
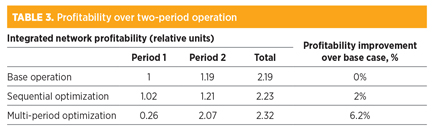
In particular, when product prices are expected to be higher in future periods, the MPO approach deliberately reduces product sales rates, instead increasing inventories that can be sold more profitably in subsequent periods. In contrast, the sequential optimization approach myopically optimizes the network operation based only on the present period’s product demands and prices.
TAKEAWAY
Significant economic benefits can be achieved via the holistic optimization of natural gas production and processing networks. The use of detailed, physics-based models of processing plants in this context significantly increases the probability of the solutions obtained being both optimal and practically implementable. Moreover, notwithstanding the underlying mathematical complexity, such optimizations are now feasible using current process
modeling technology.
Even higher benefits may be achieved via the extension of this approach to supply chain optimization over multiple periods, thereby bridging commercial planning with operational decisions. However, the computational cost increases significantly with the number of periods, and specialized MPO solvers are likely to be necessary for solving problems of practical interest. GP
NOTE
aBGC is a JV between Iraq’s South Gas Co., Shell and Mitsubishi. BGC is tasked with rejuvenating and expanding Iraq’s gas infrastructure.
LITERATURE CITED
1Thijssen, N., “Supporting supply chain planning and scheduling decisions in the oil and chemical industry,” Computers and Chemical Engineering, Vol. 28, 2004.
2Pantelides, C. C., K. M. Nauta and M. V. Matzopoulos, “Equation-oriented process modelling technology: Recent advances and current perspectives,” Proceedings of 5th Annual Takreer-Idemitsu Workshop, Takreer Research Centre, Abu Dhabi, 2015.
 |
Daniel Aluma is a project manager with Shell. He previously held process engineering roles in front-end design and operations support for Shell’s GTL facilities globally. For the past four years, he has been on secondment to Basrah Gas Co. (a Shell JV) in Iraq, with responsibility for projects to gather and process associated gas. Mr. Aluma is a chartered engineer and member of the Institution of Chemical Engineers (IChemE). He holds a BEng degree (hons) in chemical engineering, and an MSc degree in chemical engineering from TU Eindhoven in The Netherlands. He is completing his PhD in process systems engineering at Imperial College in London.
 |
Nort Thijssen holds a master’s degree in mathematics (operations research) from the University of Technology in Eindhoven, The Netherlands. He joined Shell in 1981 at its research center in Amsterdam, developing algorithms for refinery planning and scheduling. From 1998 onward, he has been responsible for the maintenance, support, development and use of strategic business planning systems. At present, he is discipline lead for network master planning and optimization, and principal consultant in the area of energy system modeling.
 |
Dr. Maarten Nauta joined Process Systems Enterprise in 2008 as a consulting engineer. Since 2013, he has led the development of Process Systems Enterprise’s gPROMS ProcessBuilder. Dr. Nauta received his MSc degree in electrical engineering, and a PhD in modeling and monitoring and control strategies for diesel engine after-treatment systems, both from Eindhoven University of Technology in The Netherlands.
 |
Costas Pantelides is the managing director and one of the founders of Process Systems Enterprise, and also a professor of chemical engineering at Imperial College in London. He has more than 30 years of experience in process modeling technology. He is a fellow of the Royal Academy of Engineering, and was recently awarded the Institution of Chemical Engineers’ Sargent Medal for his contributions to computer-aided process engineering.
 |
Nilay Shah is a professor of process systems engineering at Imperial College in London. His research interests include the application of process modeling and mathematical/systems engineering techniques to analyze and optimize complex, spatially and temporally explicit energy systems, among other areas. He has published widely and is focused on the transfer of technology from academia to industry.


Comments