Global downstream processing capital expenditures nears $1.9 T
The following is an excerpt from Hydrocarbon Processing’s Market Data 2020 analysis report. The report details major trends, initiatives, regulations, etc. that are affecting the midstream and downstream processing industries, as well as a breakdown on capital expenditures for nearly every country around the world. Market Data 2020 also provides a forecast on capital, operations and maintenance spending in 2020.
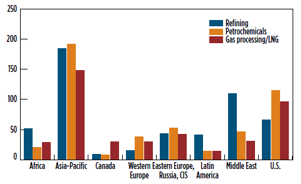
Hydrocarbon Processing’s Construction Boxscore Database is tracking more than 1,430 projects around the world, representing nearly $1.9 T in capital expenditures. The following is a breakdown of active project market share by sector:
- Refining—36% (522 projects)
- Petrochemicals—35% (489 projects)
- Gas processing/LNG—29% (421 projects).
The Asia-Pacific region accounts for approximately 37% of active projects globally, followed by the U.S. and Middle East regions. In total, the Asia-Pacific, Middle East and U.S. regions represent nearly 70% of active projects globally.
In 2020, the hydrocarbon processing industry’s capital, maintenance and operating budgets are expected to reach nearly $440 B. Asia continues to invest heavily in all areas of the downstream sector. This buildout includes additional capacity to satisfy demand for transportation fuels, petrochemicals and natural gas. With the continued increase in shale gas production, the petrochemical and gas processing/LNG industries in the U.S. continues to witness capital-intensive capacity builds in midstream and downstream projects, such as ethylene and ethylene derivative units, methanol and ammonia/urea plants, gas processing and natural gas pipeline infrastructure and LNG liquefaction trains/export facilities. The Middle East is investing heavily in boosting its downstream products portfolio—low-sulfur and ultra-low-sulfur (ULS) transportation fuels and high-valued petrochemical products—and significantly increasing gas processing capacity and natural gas logistics infrastructure.

FIG. 1. Total active projects by region and sector, October 2019.
Refining. Regardless which forecast is consulted, global oil demand will continue to increase to the mid-2020s. Most of the increase in oil demand will come from transportation fuels, primarily gasoline, diesel and jet fuel. However, a sizable portion of oil demand will be used to produce feedstock for petrochemicals generation. This increase in oil demand is being led by the Asia-Pacific region, followed by the Middle East. At present, global refining capacity is more than 101 MMbpd. By 2025, global distillation capacity is forecast to increase to 108 MMbpd–109.4 MMbpd. The Asia-Pacific region will be the leader in new refining capacity within the forecast period, led by capacity additions in China and India. To combat the effects of increased emissions, dozens of countries around the world are increasing pressure on refiners to reduce the amount of sulfur in transportation fuels, primarily in diesel and gasoline, as well as in marine shipping fuels (e.g., IMO 2020). Due to the advancement of clean fuels legislation, the industry will witness a surge in secondary unit capacity additions within the same time frame. According to OPEC, nearly 12 MMbpd of new secondary unit capacity will begin operations by 2024. These capacity additions include more than 6 MMbpd of new desulfurization capacity, more than 3 MMbpd of conversion capacity and more than 1.7 MMbpd of octane-boosting capacity. Most of this new capacity will be in the Asia-Pacific and Middle East regions. This processing capacity will be added through the construction of greenfield refineries, as well as through plant upgrades and expansions.
Petrochemicals. Over the past several years, investments in petrochemical capacity additions have skyrocketed. Hundreds of billions of dollars have and will be invested in additional petrochemical units and complexes. Most capital expenditures will be made in three primary regions—Asia, the Middle East and the U.S. The IEA forecasts that approximately 25% of the increase in oil consumption to 2023 will be from demand for petrochemical feedstocks. In total, petrochemicals production is forecast to increase from approximately 400 MMtpy in 2020 to nearly 600 MMtpy in 2050. The petrochemicals sector holds a 35% market share in active projects globally—representing nearly 490 projects. The Asia-Pacific and U.S. regions account for more than 60% of active petrochemical projects around the world. Both regions are investing heavily in new petrochemical capacity; however, Asia is primarily building new units to satisfy increasing regional demand, while the U.S. is focused more on exporting petrochemical products to demand centers, such as Asia and Central and South America.
Gas processing/LNG. Natural gas consumption will continue to surge to 2040. The primary driver for additional natural gas demand is the move by many nations to switch to natural gas for power generation. The main driver of demand will be from the Asia-Pacific region, primarily China and India. Both nations have ambitious initiatives to substantially increase natural gas in total energy mix. The increase in natural gas demand will continue to boost the need for additional LNG import and export capacity, as well as new pipeline infrastructure. The leader in global gas trade will be LNG. Although Australia was the leader in new liquefaction capacity growth over the past decade, the U.S. is expected to begin operations on more than 71 MMtpy of new LNG export capacity by the end of the decade. LNG regasification builds will be led by China and India, as both markets are switching to natural gas for power generation.

- Freeport LNG export plant in Texas reports shutdown of liquefaction train
- TotalEnergies and Mozambique announce the full restart of the $20-B Mozambique LNG project
- RWE strengthens partnerships with ADNOC and Masdar to enhance energy security in Germany and Europe
- Five energy market trends to track in 2026, the year of the glut
- Venture Global wins LNG arbitration case brought by Spain's Repsol


Comments