
Precooling strategies for efficient natural gas liquefaction
The invention of the propane precooled mixed refrigerant (C3MR) natural gas liquefaction process in 1970 brought about better efficiency and greater economies of scale than had previously been available to the young LNG industry. Splitting the refrigeration duty between two refrigerants allows each to be individually optimized; the first is used to precool the natural gas feed to a moderate temperature, and the second is used to liquefy and subcool the precooled gas to produce LNG. Due to these advantages, precooling is used in a majority of baseload LNG trains today.
Various precooling refrigerants have been proposed in the LNG industry, such as propane, mixed refrigerant (MR), ammonia, carbon dioxide (CO2), ethane, propylene and fluorocarbons. Guidelines are provided here for selecting an optimal precooling refrigerant, considering multiple factors, such as efficiency, precooling temperature, operability, refrigerant availability, flammability, ambient temperature and safety. Additional thermodynamic factors that are relevant in the selection, such as specific heat ratio and critical temperature, are also discussed.
A direct comparison is also provided of several precooling refrigerants, highlighting the benefits and drawbacks of each, and demonstrating that optimal selection of both the precooling refrigerant and the precooling configuration plays a critical role in driving project success.
Selection of a liquefaction process cycle is a key component in the design of a natural gas liquefaction facility. It is driven by various factors including design capacity, ambient temperature, plot space availability, floating or land-based applications and others. A crucial decision that impacts this selection is whether the cycle should involve a dedicated precooling circuit and, if so, which precooling refrigerant should be used.
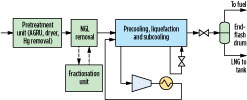
Fig. 1 shows a simplified schematic for an LNG facility. Natural gas is first pretreated to remove contaminants including acid gases, water and mercury, after which it is optionally sent to an NGL removal unit for removal of C2–C5 hydrocarbon components. NGL removal may be performed prior to precooling, as shown in Fig. 1, or it may be integrated with the precooling and liquefaction processes. The NGL stream may be sent to a fractionation unit, where individual components are separated for sale or used as refrigerant makeup in the facility.
 |
|
Fig. 1. Simplified schematic of a natural gas liquefaction facility. |
Heavy hydrocarbons (C6+ components) may be removed with the NGL stream. Some facilities include a separate heavy hydrocarbons removal unit to prevent freeze-out of these components during liquefaction. The pretreated gas is then precooled, liquefied and subcooled against at least one cold refrigerant stream to produce LNG. The refrigerant is compressed and cooled using air or cooling water prior to providing the refrigeration duty. The LNG is reduced in pressure and may be sent to an endflash drum before it is sent to the storage tank. Any endflash vapor generated during pressure letdown is typically used as fuel gas.
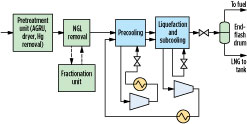
The refrigeration duty for the precooling, liquefaction and subcooling processes may be provided by a single refrigerant, as shown in Fig. 1, or it may be split among multiple cooling sections, each with individually optimized refrigerants. Fig. 2 shows a precooled gas liquefaction process with two refrigerant circuits, a precooling circuit with a precooling refrigerant for cooling the pretreated gas to –20°C to –50°C, and a liquefaction circuit with a main refrigerant for liquefying and subcooling the precooled natural gas to an LNG temperature of approximately –130°C to –150°C. The main refrigerant is cooled to ambient temperature with air or cooling water, and then to about –20°C to –50°C against the precooling refrigerant prior to providing liquefaction duty to the feed.
 |
|
Fig. 2. Simplified schematic of a precooled natural gas liquefaction facility. |
The primary benefits of a dedicated precooling circuit are as follows:
- It debottlenecks the liquefaction circuit, since both the natural gas feed and the main refrigerant are precooled prior to being introduced into the main exchanger. This reduces the main refrigerant circulation rate, liquefaction heat duty requirement, and main exchanger size.
- It allows for independent optimization of each refrigerant.
These benefits lead to an improvement in overall efficiency of up to 20%, depending on feed conditions and project requirements, and make dedicated precooling circuits desirable for baseload LNG facilities.
Heat transfer mechanism and precooling configuration. Two heat transfer mechanisms by which precooling and liquefaction take place are boiling and sensible. In boiling heat transfer, liquid refrigerant is vaporized, taking advantage of the latent heat of vaporization to provide cooling duty. In sensible heat transfer, refrigerant is warmed without undergoing phase change to provide the same cooling duty.
For most fluids, the latent heat capacity of vaporization is 4–6 times greater than the sensible heat capacity; therefore, more refrigeration per mass of refrigerant can be obtained by latent heat transfer than by sensible heat transfer. Boiling heat transfer reduces the refrigerant circulation rate, which results in higher efficiency and lower equipment size. Only boiling precooling refrigerants are considered here.
Another proposed configuration is an absorption-based cycle, such as using aqueous LiBr. The precooling temperature achievable by aqueous LiBr is limited to 0°C, the freezing point of water. Deeper precooling is generally preferred, as it maximizes the overall process efficiency of the liquefaction process. Other absorption-based processes, such as ammonia absorption, have been proposed but are not evaluated here due to operational considerations that are outside the scope of this study.
Single- and multiple-pressure evaporative precooling configurations are widely used due to their high efficiency, simple operability, versatility and low cost. Many refrigerants have been employed in these processes, such as pure components, multi-components and azeotropic mixtures.
With a pure-component, single-pressure configuration, all of the refrigerant evaporates at a fixed temperature. The efficiency of this process can be significantly improved by adding additional pressure levels. Each pressure level provides refrigeration at a progressively lower temperature, so only a fraction of the refrigeration is provided at the coldest temperature.
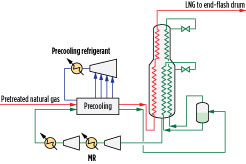
Three- and four-pressure precooling configurations are advantageous for LNG train capacities of 3 MMtpy–5 MMtpy. An example of a pure-component, multi-pressure precooling configuration is shown in Fig. 3. The pretreated natural gas is precooled against a precooling refrigerant prior to being liquefied and subcooled against mixed refrigerant (MR) in the main cryogenic heat exchanger (MCHE), which is shown as a coil-wound heat exchanger. Coil-wound heat exchangers are state-of-the-art exchangers for gas liquefaction and are known for their high thermal stability, safety, small footprint and high heat transfer area. They contain helically wound tube bundles housed within an aluminum or stainless steel pressurized shell. The MCHE in Fig. 3 contains two bundles: warm (bottom) and cold (top).
 |
|
Fig. 3. Four-pressure, pure-component precooling and MR liquefaction configuration. |
Precooled natural gas feed enters the bottom end of the MCHE, where it is cooled, liquefied and subcooled as it flows through tubes and exits as LNG. Refrigeration is provided by boiling MR on the shell side of the MCHE. MR is a mixture of nitrogen, methane, ethane or ethylene, propane, butanes and other hydrocarbons. A warm, low-pressure MR stream withdrawn from the warm bundle is compressed in a series of compressors, cooled against ambient air or cooling water, and further cooled against the precooling refrigerant. It is then sent to a phase separator to produce an MR vapor (MRV) stream and an MR liquid (MRL) stream, both of which are cooled in the tubes of the MCHE. At the top of the warm bundle, the cooled MRL is flashed across a Joule-Thomson (J-T) valve and sent to the shell side of the warm bundle to provide refrigeration duty. At the top of the cold bundle, the liquefied MRV is flashed across a J-T valve and sent to the shell side of the cold bundle to provide refrigeration duty. The shell-side fluids vaporize and provide cooling duty to the fluids in the tubes.
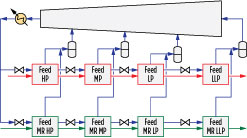
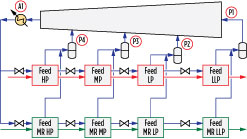
Fig. 4 shows the details of the precooling circuit. The precooling refrigerant is a pure component, such as propane in the case of the proprietary C3MR cycle, and is vaporized at four pressure levels. Natural gas and MR are cooled against the boiling refrigerant in parallel heat exchangers, as shown in Fig. 4. The refrigerant is condensed and subcooled prior to being divided into two streams, one for each parallel set of heat exchangers. The subcooled refrigerant is then let down in pressure and partially vaporized in the high-pressure (HP), medium-pressure (MP) and low-pressure (LP) exchangers.
 |
|
Fig. 4. Four-pressure precooling process configuration. |
The vapor streams produced from each stage are mixed and introduced into the precooling compressor as HP, MP and LP side streams, while the liquid streams produced in each stage are let down in pressure and sent to the subsequent exchangers. The precooling fluid is fully vaporized in the final low-low pressure (LLP) exchanger, sent to a suction drum to remove any liquid, and subsequently sent to the suction of the precooling compressor.
Precooling refrigerant selection. Several considerations must be taken into account when selecting a precooling refrigerant. This section highlights key factors that need to be evaluated and their implications for the overall process.
Desired precooling temperature. A key optimization variable for a liquefaction process is the temperature of the natural gas and MR leaving the precooling section, which is called the “precooling temperature” or “cut temperature.” The lowest precooling temperature for a specific configuration depends primarily on the refrigerant composition and the lowest pressure at which it boils. Typically, the lowest pressure is kept at a positive pressure (i.e., non-vacuum), to prevent air ingress in the event of minor leaks. Air ingress will affect the precooling performance. For flammable refrigerants, it is a potential safety issue.
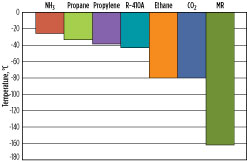
Assuming typical process parameters (a pressure of 1.1 bara at the compressor suction, a 0.2-bar pressure drop in the suction drum, and a 3°C approach temperature in the LLP exchanger), Fig. 5 presents the lowest precooling temperature achievable for seven different precooling refrigerants: propane, ammonia, propylene, ethane, R-410A, CO2 and MR. R-410A is a 50–50 wt%, near-azeotropic blend of hydrofluorocarbons (HFCs) R32 and R125.
 |
|
Fig. 5. Lowest precooling temperature achievable without a vacuum design. |
In this group, ammonia has the warmest precooling temperature of approximately –25°C. Propane, propylene and R-410A have lower precooling temperatures, while ethane and CO2 can be precooled to as low as –80°C. MR may be used as a precooling and/or main refrigerant, and has the ability to cool the natural gas, liquefy it to LNG, and subcool the LNG to colder temperatures. As a result, it does not have a precooling temperature limit; however, beyond the liquefaction temperatures, it is no longer considered a precooling refrigerant.
Optimal precooling temperature. Although a refrigerant can cool natural gas to a certain temperature, it may not be optimal to do so. An optimal precooling temperature exists that results in the highest overall process efficiency. The optimal precooling temperature is driven by the ambient temperature and relative efficiencies of the precooling and main refrigerants. For cooler ambient conditions, it may be preferable to precool the natural gas to lower temperatures.
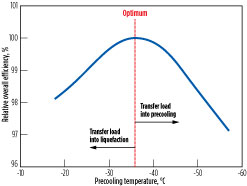
Fig. 6 shows the overall process efficiency vs. precooling temperature for a dual MR (DMR) process that utilizes separately optimized MR streams as the precooling and main refrigerants. The optimal precooling temperature is –37°C, based on specific process conditions for the scenario considered. The optimal precooling temperature varies as the ambient temperature and process conditions of the gas feed change. As the precooling temperature warms, refrigeration load is transferred into the liquefaction system, and the main refrigerant must be optimized for a larger temperature range.
 |
|
Fig. 6. Optimal precooling temperature for a DMR process at specific process conditions. |
Conversely, as the precooling temperature cools, refrigeration load is transferred into the precooling system. The shape of the optimum curve and sensitivity to warmer vs. colder precooling temperature varies on a case-by-case basis and is a strong function of the choice of precooling and liquefaction refrigerants, configurations, ambient temperature and other factors.
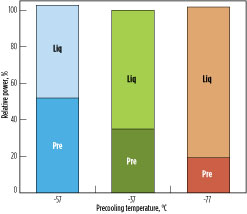
Fig. 7 shows the power split for the precooling and liquefaction circuits as the precooling temperature differs from the optimum. At a warmer precooling temperature, the precooling power requirement is reduced and the liquefaction power requirement is increased. The temperature difference between hot and cold sides in the MCHE increases, lowering the overall efficiency. On the other hand, at a lower precooling temperature, the precooling power requirement is increased and the liquefaction power requirement is reduced. In this case, the temperature difference between the hot and cold sides of the precooling exchanger increases, reducing the overall efficiency of the process.
 |
|
Fig. 7. Optimal precooling temperature: Precooling (Pre) and liquefaction (Liq) power requirements. |
Refrigerants with deeper precooling ability may be advantageous for applications in colder ambient conditions1 because lower precooling temperature provides a better balance between the precooling and liquefaction heat duties.
The precooling temperature impacts the driver power split desirable for a given project. Selection of the driver2 and machinery configurations,3 while not within the scope of this article, are also important factors that require consideration during the design phase.
Process efficiency. One of the most important factors to be evaluated is the overall process efficiency, since the need for higher efficiency is often a justification for precooling. The efficiency of a precooling process measures how much power is required to provide a given amount of refrigeration.
For a precooled process using a boiling main refrigerant, such as MR, about 75% of the total precooling heat duty goes toward partially condensing the main refrigerant. Approximately 25% of the heat duty provides precooling to the feed. In other words, precooling reduces the load on the liquefaction circuit by precooling both the feed and the MR.
Several factors influence the process efficiency of a refrigerant. The ratio of the constant-pressure specific heat and the constant-volume specific heat, also known as the specific heat ratio, is an important parameter (Eq. 1). Most of the commercially practical refrigeration processes compress the vapor refrigerant, which can be modeled as a polytropic process.
For a polytropic compression process, Eq. 2 gives the relationship between the pressure and temperature of a fluid. The combination of Eqs. 1, 2 and 3 illustrates that, for a given pressure ratio, the temperature rise of a refrigerant during compression is determined by the specific heat ratio of the refrigerant. As the ratio increases, the temperature at the compression outlet warms, which indicates that more work is expended during compression. Conversely, as the specific heat ratio decreases, the temperature at the compression outlet cools, thereby making the process more efficient. Generally, refrigerants with a low specific heat ratio are preferred.
(1)
(2)
(3)
where:
k = Specific heat ratio
cp = Specific heat at constant pressure
cv = Specific heat at constant volume
ηp = Polytropic efficiency
P = Pressure
T = Temperature
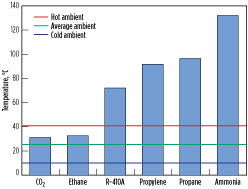
Critical temperature. The critical temperatures of various pure-component refrigerants are shown in Fig. 8. The critical point is the point on the phase diagram (see Fig. 9) where the dew and bubble lines meet. Above the critical temperature, both gas and liquid phases have the same density and cannot be separated. Fig. 8 also includes lines that represent an average ambient temperature of 25°C, a hot ambient temperature of 40°C and a cold ambient temperature of 10°C. CO2 and ethane have the lowest critical temperature of approximately 31°C.
 |
|
Fig. 8. Precooling refrigerant critical temperatures. |
 |
|
Fig. 9. P-H diagram for subcritical (left) and transcritical (right) processes. |
For CO2 and ethane applications at cold ambient temperature, it may be possible to operate the process below the critical temperature so that the process functions similarly to any other subcritical process. However, for hot and likely average ambient cases, the refrigerant temperature will be higher than the critical point, causing the process to be transcritical in nature.
Another scenario where CO2 and ethane would function as subcritical refrigerants is when the natural gas arrives cold—for instance, if it is already precooled to –30°C, and if CO2 or ethane is used to liquefy or further cool the natural gas.
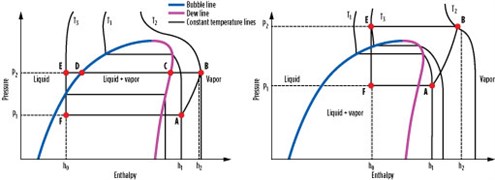
Fig. 9 shows a pressure-enthalpy (P-H) diagram for subcritical and transcritical processes. In a subcritical process (Fig. 9, left), the refrigerant vapor (A) is at a pressure of P1 and a temperature of T1, and is compressed to pressure P2 and temperature T2 (B). The compressed vapor is then desuperheated to the dewpoint (C), condensed to the bubble point (D), and subcooled to produce subcooled liquid (E). The subcooled liquid is then flashed to the original pressure, P1 (F), and vaporized to complete the cycle and return to vapor phase (A). During steps B through E, the process rejects heat to ambient air or cooling water. During steps F through A, the process provides cooling duty to a process stream.
In a transcritical process (Fig. 9, right), the cycle diagram looks similar; however, the heat rejection steps B through E occur above the critical point. The process starts with refrigerant vapor (A) at pressure P1 and temperature T1 below the critical temperature. It is then compressed to pressure P2 and temperature T2 (B), which is above the critical temperature.
Above the critical point, a fluid does not possess distinct vapor and liquid phases. Therefore, when it is cooled from point B to point E, it does not condense. The fluid exhibits vapor-like properties at point B and liquid-like properties at point E. However, unlike the subcritical condensing process, where temperature stays constant during the condensation process (steps C through D), the temperature decreases continually during the transcritical heat-rejection step.
The temperature at point E after heat rejection is set by the ambient temperature plus a heat exchanger approach temperature. Due to the vertical nature of the constant temperature lines above the critical point, point E is in the central portion of the graph. Therefore, when refrigerant is let down in pressure from point E to point F, a two-phase stream with large amounts of vapor is produced. Point F typically has a higher vapor fraction in a transcritical process than in a subcritical process, which leads to a lower process efficiency.
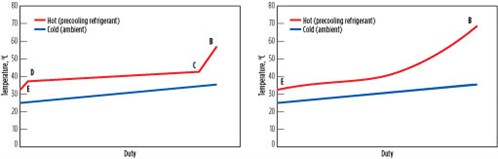
Fig. 10 shows a graph of hot- and cold-side temperatures vs. heat duty, also known as “cooling curves,” for the heat-rejection steps B through E in a subcritical process using propane, as well as in a transcritical process using CO2. For a subcritical process, desuperheating, condensing and subcooling zones are distinct, and a majority of the cooling is provided during condensation. In a transcritical process, the zones are not distinct and the temperature difference between the hot and cold sides increases at the warm end, leading to inefficiency. This process further reduces the efficiency of transcritical processes.
 |
|
Fig. 10. Cooling curves for subcritical (left) and transcritical (right) cooling. |
Generally, refrigerants with critical temperatures above the ambient temperature plus approach temperature are preferred to ensure stable subcritical operation. Some challenges associated with transcritical operation include:
- Lower process efficiency
- Challenges with supercritical refrigerant storage in the accumulator
- Lack of references with transcritical refrigerants in baseload LNG facilities.
Refrigerant availability. Several natural gas liquefaction facilities are in remote locations where importing refrigerants is difficult and/or expensive. For such projects, it is preferable to use refrigerants available in the natural gas feed. Some refrigerants are present in the natural gas itself, such as propane, ethane and components of MR, and may be extracted using a fractionation system, depending on the feed gas composition.
Flammability. Refrigerant flammability is also an important consideration, especially for FLNG projects. It is desirable to minimize the onboard flammable inventory, specifically the propane inventory. Therefore, certain precooling refrigerants are better suited for FLNG applications than others.
Additional considerations. Other factors that should be taken into account include corrosiveness, toxicity, global warming potential, equipment count and size. Corrosive refrigerants are detrimental to heat exchangers and other equipment, reduce equipment life, and increase the frequency of shutdowns for repairs. They are also unfavorable for overall plant availability and economics. Safe, nontoxic and environmentally friendly refrigerants with low global warming potential are preferable.
Equipment size and count impact capital cost, and are driven by the precooling configuration, refrigerant, operating pressure and other process conditions. Equipment size is a function of both the specific heat capacity and the density of the refrigerant. As the specific heat capacity increases, the mass of refrigerant required decreases. Lower refrigerant mass flowrate and higher density lead to smaller pipe sizes.
Site- and feed-specific precooling refrigerant evaluation. Various precooling refrigerant options are presented for a land-based natural gas liquefaction project of 5 MMtpy nominal capacity. The ambient temperature is 25°C, and air coolers with an air temperature rise of 10°C are used. Natural gas feed is at a pressure of 70 bara and contains 90% methane and a significant amount of NGL components. As shown in Fig. 2, the process involves an acid gas removal unit (AGRU), followed by removal of water, mercury, heavy hydrocarbons and NGL. The pretreated natural gas is precooled in the precooling system, followed by liquefaction and subcooling in the MCHE. LNG is let down to storage pressure, and the vapor produced by flashing is sent to fuel.
Precooling circuit. The precooling configuration is illustrated in Fig. 4 and involves four pressure levels and parallel precooling of the natural gas and main refrigerant. Six cases with different precooling refrigerants were performed. A seventh case was done using MR as the precooling fluid at a single pressure level.
The following precooling parameters were held constant in all cases:
- A fixed precooling temperature of –25°C; this value is based on ammonia that has the warmest achievable precooling temperature among the refrigerants considered, as shown in Fig. 5
- Heat transfer coefficient times heat exchanger area (UA) for the desuperheater, condenser and subcooler heat exchangers, which ensures that the analysis is based on the same number of air cooler bays
- Pressure drop across each unit operation
- Approach to ambient temperature for the desuperheater, condenser and subcooler heat exchangers
- Air temperature rise for the desuperheater, condenser and subcooler heat exchangers
- Minimum allowable temperature difference between the refrigerant and the process stream in all eight heat exchangers.
 |
|
Fig. 11. Optimized parameters in four-pressure precooling circuit. |
The following precooling parameters were optimized in each case, as highlighted in Fig. 11:
- Four pressure levels: P1, P2, P3 and P4
- Air flowrate A1, which was varied to yield a fixed air temperature rise.
Liquefaction circuit. For all cases considered, the liquefaction and subcooling heat duty are provided by MR in the configuration shown in Fig. 3. Several parameters were held constant in the liquefaction circuit:
- Natural gas and LNG pressure, temperature and flowrate throughout the liquefaction circuit
- MR pressure, temperature and flowrate throughout the liquefaction circuit
- Pressure drops across all equipment
- Fuel flowrate
- Air temperature rise
- Air cooler UAs
- J-T valve outlet pressure.
In essence, no parameters in the liquefaction circuit were allowed to vary, and the resulting liquefaction power is the same for all cases.
Machinery. The precooling and liquefaction compressors were modeled as polytropic, with a fixed efficiency of 83% in all cases. No machinery constraints were imposed in any of the cases. Therefore, the analysis is not biased toward any specific machinery selections, such as driver choice and driver-compressor arrangements.
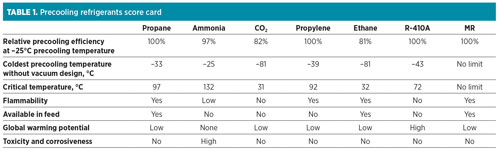
Results and discussion. A score card comparing the seven precooling fluids against the key selection parameters is shown in Table 1.
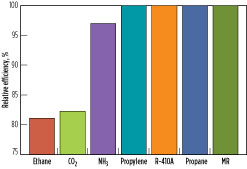
Precooling efficiency. The relative precooling process efficiency of the refrigerants at a fixed precooling temperature of –25°C is shown in Fig. 12. Among this group of refrigerants, propane, propylene, MR and R-410A have the highest efficiency. One reason for this is the low specific heat ratio, Cp/Cv, for these refrigerants. Ammonia has 3% lower precooling efficiency than propane. One of the factors causing this is its higher Cp/Cv ratio compared to propane. Ethane and CO2 have the lowest efficiencies because of their higher specific heat ratios and the transcritical nature of these processes, as demonstrated in Fig. 9 and Fig. 10. Although ethane and CO2 have similar critical temperatures, CO2 has a slightly better efficiency than ethane, partly due to its slightly lower Cp/Cvratio compared to ethane.
 |
|
Fig. 12. Relative precooling efficiencies at a fixed precooling temperature of –25°C. |
Of the seven refrigerants compared in Table 1, propane, propylene, ammonia, ethane and CO2 are pure-component refrigerants. R-410A, being a near-azeotropic blend of R32 and R125, functions similarly to a pure-component refrigerant. These refrigerants were evaluated in a four-pressure precooling configuration. MR, on the contrary, is a multi-component refrigerant comprising (in this instance) nitrogen, methane, ethane/ethylene, propane and butane, and was evaluated in a single-pressure precooling configuration. Even for single-pressure MR precooling, the overall process efficiency is comparable to multiple-pressure propane precooling. This is because the hydrocarbon mixture boils over a wide temperature range, leading to a smooth cooling curve, and provides an opportunity to optimize cooling curves with small temperature differences and high efficiency.
 |
The efficiency for a precooled process can be further improved by adding features such as inlet air chilling, gas turbine heat recovery, endflash gas recycle, hydraulic turbines, boiloff gas (BOG) reliquefaction and others. However, these features are not limited to specific precooling refrigerants and may be applied across the board. When comparing processes with different precooling refrigerants, it is crucial to compare them based on the same features.
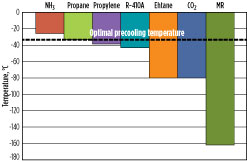
Precooling temperature. As shown in Fig. 5, the precooling temperature achievable varies with the refrigerant. Fig. 13 shows the optimum precooling temperature that yields the highest overall process efficiency for this application. Note that the optimal temperature is a strong function of ambient temperature, process conditions and liquefaction process selection, and must be determined on a case-by-case basis.
 |
|
Fig. 13. Optimal precooling temperature based on ambient temperature, site-specific. |
With the exception of ammonia, which is limited to a precooling temperature of approximately –25°C, all of the other precooling refrigerants can precool to the optimal precooling temperature and offer an advantage over ammonia. As mentioned previously, the relative efficiencies in Fig. 12 are shown for a fixed precooling temperature of –25°C for all of the fluids to ensure a common basis. However, all of the fluids, other than ammonia, have the advantage of precooling to the optimal temperature. For instance, propane precooling at –33°C provides an additional improvement in overall efficiency as compared to propane precooling at –25°C.
Although fluids like CO2, ethane and MR can precool to very cold temperatures, it was not optimal to precool to these temperatures. Propane precooling temperature was found to be close to optimal for typical ambient conditions. As the ambient temperature cools, the optimal precooling temperature decreases, and refrigerants with colder precooling ability are advantageous.
Project conditions and liquefaction cycle selection. Considerations for the liquefaction cycle selection in light of project conditions are discussed in the following sections.
Critical temperature. The critical temperatures of the refrigerants are shown in Fig. 8. A higher critical temperature implies that the process can operate at high ambient temperatures within the subcritical regime. Propane, propylene, ammonia and R-410A have critical temperatures higher than 70°C, which is well above typical hot ambient temperatures. Being a mixture of multiple hydrocarbons, critical temperature is not an issue for MR. CO2 and ethane have a critical temperature of approximately 31°C, causing these processes to involve transcritical cooling at cold ambient temperatures.
Flammability. An advantage of non-hydrocarbon refrigerants, such as CO2, R-410A and ammonia, is that they reduce flammable inventory onsite. Propane, being an LPG component, is typically not preferred for FLNG service. MR also includes flammable hydrocarbons; however, they can be designed to operate efficiently without propane, and have gained prominence for FLNG applications.
Refrigerant availability. Propane, ethane and components found in MR have the advantage of being present in typical natural gas feed. Depending on the feed gas composition, it may be possible to generate sufficient quantities of these components onsite, using an NGL removal and fractionation system. While CO2 has a slightly higher efficiency than ethane, the availability of ethane in the feed gas is a significant advantage for ethane over CO2.
Global warming potential. HFC refrigerants, including R-410A, typically have high global warming potential, which must be kept in mind when making a selection. This is not an issue for the other refrigerants considered.
Toxicity and corrosiveness. Unlike the other precooling refrigerants evaluated, ammonia has the significant disadvantage of being both highly corrosive and toxic in nature, which may have serious implications for safety, equipment life, cost, plant availability and overall facility performance.
Recommendations. Over the past few decades, precooling has been implemented in a majority of baseload gas liquefaction facilities and has improved the efficiency, increased the capacity and enhanced the overall performance of these processes. Multiple precooling refrigerants and configurations have been proposed in the LNG industry. Various considerations must be taken into account when making a selection for a project.
Here, seven precooling fluids have been directly compared: propane, MR, ammonia, CO2, ethane, propylene and fluorocarbons. The refrigerants were evaluated on a fixed basis against several important parameters, such as efficiency, precooling temperature, refrigerant availability, flammability, operability, ambient temperature and safety. These factors, along with key thermodynamic parameters (such as specific heat ratio and critical temperature), have a significant impact on the precooling process and must be closely evaluated on a case-by-case basis.
Of the precooling refrigerants proposed, propane and MR possess several advantages, such as high efficiency, deep precooling temperature, subcritical operation and simplicity. They are also well proven and easily available. They are both nontoxic and noncorrosive, and have low global warming potential. MR possesses the additional benefits of low propane inventory, a small footprint and deeper precooling temperature, which make it a preferred choice for FLNG and cold ambient applications.
The actual selection of precooling refrigerant for a specific application should be carefully determined based on the parameters highlighted here, along with project-specific requirements and site conditions. The optimal selection of both the precooling refrigerant and the precooling configuration plays a crucial role in overall plant economics and performance. GP
Literature cited
- Schmidt, W. P., C. M. Ott, Y. N. Liu and J. W. Wehrman, “Arctic LNG plant design: Taking advantage of the cold climate,” LNG17, April 2013.
- Schmidt, W. P., C. M. Ott, Y. N. Liu and W. A. Kennington, “How the right technical choices lead to commercial success,” LNG16, 2010.
- Krishnamurthy, G., M. J. Roberts and J. W. Wehrman, “Drive your LNG project to success with optimal machinery selections,” LNG Journal, May 2015.
Acknowledgment
The authors would like to thank William P. Schmidt for his valuable contributions to this work.
 |
Gowri Krishnamurthy is a Senior Research Engineer in the LNG Process Technology group at Air Products. She has participated in the development of liquefaction process cycles and heat exchanger designs for several LNG projects, including both land-based and FLNG, and has also participated in plant performance tests. Dr. Krishnamurthy is actively involved in various research and development (R&D) initiatives for the development of new and improved natural gas liquefaction processes and heat exchanger designs, and is listed as an inventor on 15 patent applications. In addition, she is responsible for intellectual property strategy and development for the LNG business at Air Products, and is a registered patent agent with the US patent office. Dr. Krishnamurthy also has experience in R&D for reaction engineering, adsorption and renewable energy. She holds a BS degree in chemical engineering from the Indian Institute of Technology (IIT) at Chennai and a PhD in chemical engineering from Purdue University in Indiana.
 |
Mark J. Roberts is an Engineering Associate in LNG at Air Products. He joined Air Products in 1996, and has 26 years of experience in developing cryogenic cycles for gas separation and liquefaction. Several US and international patents have been issued in his name, including the patent for the AP-X process. His responsibilities include developing and evaluating new approaches to LNG liquefaction and technical support of sales estimates for Air Products’ LNG business.
 |
Christopher M. Ott is the Lead Process Engineer for the LNG Process Technology Group at Air Products. He joined Air Products in 2001 after receiving his BS degree in chemical engineering from Villanova University. He began working for Air Products in process design work for LNG and hydrocarbon cryogenics. He then moved to assignments in air separation, chemicals technology and electronics before returning to the LNG process group in 2005, where he has worked on many recent LNG projects, including several mid-size LNG and FLNG facilities. He has also participated in the startup and performance testing of many baseload and mid-size LNG plants.


Comments