An evaluation of shale gas reforming technologies—Part 2: Cost and carbon intensity estimation
Part 1 of this two-part article explored the different types of methane reforming technologies and explained the characteristics of each. Part 1 also presented a selection methodology that can be used to screen the different reforming pathways at the early stages of the project definition. In Part 2, an order-of-magnitude cost correlations carbon-footprint estimation is provided that can guide designers in making preliminary design decisions for a process that involves a reformer. A linear regression of data from gas-to-liquid (GTL), ammonia and methanol plants was used to develop the correlations using simple inputs of the natural gas feed capacity and the desired (H2/CO) ratio. The developed selection methodology and cost and CO2 emissions correlations can be useful in making technology screening, selection and process design decisions at an early stage of a project that involves the production of syngas using little information and limited details about the process.
Reforming cost estimation. In general, the reforming unit in a plant is considered to be a substantial investment, and it can contribute to up to 60%–70% of the overall cost of the plant.1-3 Additionally, various types of technologies can be selected when it comes to the reforming of methane to syngas. Such choices are based on the nature and the requirements of the project since some reforming pathways are better suited than others under certain circumstances.4 Therefore, it is important to develop technology selection and cost estimation tools to help process engineers estimate the cost of the reforming plant and make design decisions at an early stage of the project, prior to performing an expensive detailed techno-economic analysis. Analogous correlations have been reported for order-of-magnitude cost estimates of gas monetization plants and biorefineries.5,6
This work presents order-of-magnitude correlations for the cost estimate and CO2 emissions of the reforming unit while providing minimum input, such as the desired reforming capacity (in MMft3d) and the desired H2/CO ratio. The presented correlations will enable makers to expeditiously estimate the cost and CO2 emissions ranges of the reforming unit.
COST CORRELATION DEVELOPMENT METHODOLOGY
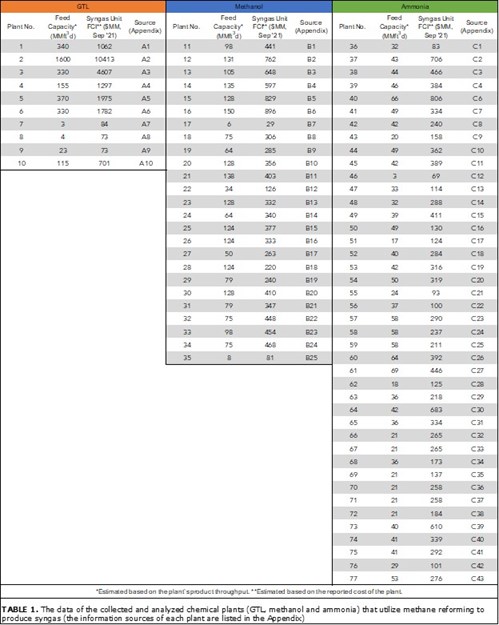
Data collection. About 85% of produced syngas is utilized in the production of chemicals and GTL. The authors surveyed and collected the economic and production data from more than 330 worldwide GTL, methanol and ammonia plants. The data of interest in this study are the capital cost, plant capacity and the year in which the plant was announced. The collected data came from multiple resources, including databases, press releases, company/vendor websites and reports. Among the 330 surveyed chemical plants, only plants that were built in the years 2000–2020 were selected for analysis to develop the cost correlation. TABLE 1 shows the capacity and cost of the selected plants. The appendix contains more information about each plant and the references.
 |
Capital cost estimation methods. The total capital investment (TCI) of a project is the sum of the fixed capital investment (FCI) or capital expenditure (CAPEX) and working capital investment (WCI). The FCI of a project consists of two components: the manufacturing FCI and the non-manufacturing FCI. The manufacturing FCI constitutes the fixed-cost expenses that are directly related to the cost of production, such as process equipment, and process installation; while the non-manufacturing FCI involves the fixed-cost items that are not directly related to the production, such as the land. The WCI is the money needed to cover the operating expenditures (OPEX) of the operation and to start up production. In general, the WCI is taken as 0.15*TCI.7
Based on the project definition, the Association for the Advancement of Cost Engineering-International (AACE) provides five classes of cost estimation.8 The least detailed class of cost estimation is for projects with 0%–2% project definition, and this cost estimation is based on basic information about the project. This type of cost estimation is referred to as an order-of-magnitude estimate. The accuracy of such an estimate is ± 30%–50%, and it is usually used to generate a rapid cost estimate for the project at the beginning. The basic information needed at this stage of the project can be based on experience from similar projects, or the capacity, the selling prices of the feedstock, and the product.
The annual costs that are associated with the production can be calculated by adding the annualized fixed cost (AFC) to the annualized operating cost (AOC) of the process. The TAC is given by Eq. 7:
TAC = AFC + AOC (7)
AFC = (FCI0-FCIs)/N (8)
where, FCI0 is the initial value of the depreciable FCI, FFCIs is the salvage value of the FCI at the end of the service life, and N is the service life of the plant in years. The annual onstream factor is assumed to be 0.93 (340 d/yr).
Capital and operating cost calculations.Typically, the cost contribution of the reforming unit to the total cost of the plant can reach up to 60%–70%. The variation in the contribution cost stems from several factors, including plant type (e.g., methanol vs. ammonia), the location of the plant, and the year the plant was built. The cost data of each plant listed in TABLE 1 was updated to September 2021 U.S. $ using the Chemical Engineering Cost Index (CECPI)9 according to Eq. 9:
CostTimeB=CostTimeA*(CECPITimeB/CECPITimeA) (9)
The FCI of the plant is then taken as 85% of the reported TCI. Since the cost contribution of the reforming unit varies depending on plant type, capacity, and reformer type, the authors have developed selection criteria (Eqs. 11, 12 and 13) to calculate the cost contribution of the reforming unit and to determine the technology of choice based on the processing capacity (C in MMft3d) and product type. The technology and capacity ranges for each process were estimated based on data and information from different sources, including vendors' websites,10,11 company releases,12 published reports,13 books3,4,14 and articles.15,16
 |
 |
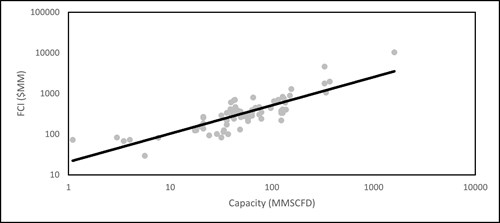
| FIG. 2. A power law plot of the compiled FCI data vs. the natural gas feed capacity of the reforming unit. |
A power law plot has been generated for the collected data from TABLE 1 to determine the unknown parameters a and x in Eq.13. The unknowns a and x were determined through linear regression of the log-log plot and found to be 15.697 and 0.7608, respectively. The empirical correlation can now be expressed as (Eq. 14):
FCI ($MM) =15.697 × C0.7608 3 MMft3d < C < 1,400 MMft3d (14)
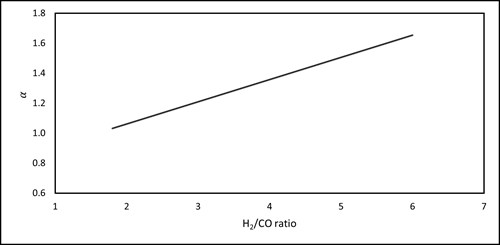
To determine the accuracy of the cost correlation in Eq.15, the FCI values in TABLE 1 were compared to those estimated by Eq.15 to calculate the % error. The standard deviation is 58% and the 95% confidence limit is between 0% and 26%.The annual operating cost (FIG. 3) could be calculated based on the capacity and the desired syngas ratio through Eq. 15:
 |
| FIG. 3. The estimated operating cost for different syngas H2/CO ratios. |
AOC = αC × PNG × 1,000 (kft3/MMft3) × 340(days/yr) (15)
α = 0.148x + 0.7658 1.8 < x < 6𝛼 = 0.148x + 0.7658 1.8 < x < 6 (16)
where, x corresponds to the desired H2/CO ratio. Eq. 17 is derived by calculating the required methane for feed (including the expense of co-reactants) and utility from R-1, R-2, and R-3. The data are then plotted and the equation of the line is obtained (Eq. 17). The conversion efficiency of reactants into syngas is assumed to be 95%. The thermal efficiency for steam generation and the endothermic reaction heat supply are 80% and 70%, respectively. Oxygen separation efficiency by a typical double-column ASU is taken as 20%.17
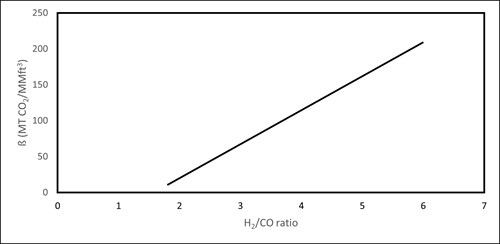
The annual CO2 emissions of the syngas production (FIG. 4) can be estimated through Eq. 17:
 |
| FIG. 4. Estimated CO2 emissions intensity w.r.t syngas H2/CO ratio. |
47.376x − 74.853 1.8 < x < 6 (18)
where, x is the desired H2/CO syngas ratio. This CO2 emissions relationship was derived and adjusted from emissions data by Afzal, et al.18 The data were extrapolated such that the relationship covers the syngas ratio range of interest in this work (H2/CO = 1.8–6).
Case study. To illustrate the use of the rapid reforming technology selection technique and cost estimation, consider Plant No. 12 in TABLE 1. The plant produces methanol (1.750 metric MMtpy) andits reforming capacity is 131 MMft3d. Methanol requires a H2/CO ratio of ~2 and the plant’s reforming capacity requirement can be met by the two-step reforming configuration (Eq. 11), and by using the cost estimation correlation (Eq. 15), we obtain (Eq. 19):
FCI = 15.697 × (131)0.7608 = $641MM (19)
When the calculated reforming FCI by the correlation is compared to the plant’s reforming FCI in TABLE 1, the value obtained by the correlation underestimatesthe plant’s reforming cost by about 16% ($641 MM vs. $762 MM). This difference in the calculated FCI is acceptable for Class 5 estimates (order-of-magnitude) that are used for quick and rapid cost estimation using only simple input such as the desired capacity of the reforming plant.
Using Eq. 8, the AFC (assuming that the plant is depreciated over 10 yr and the salvage value is 10% of FCI) is estimated to be $46 MM/yr.
For the annualized operating cost, the two-step reforming option is used. Since this is a methanol plant, the required H2/CO ratio is ~2, and assuming the cost of natural gas is $2.5/kft3 and using Eq. 16 and then Eq. 15, the annual operating cost is estimated to be $118 MM/yr. Using Eq. 7, the TAC= $176 MM/yr.
The annual CO2 emissions of the syngas production unit in this methanol plant can be calculated first by using Eq. 20 to find ß:
(47.376 × 2- 74.853) = 19.9 MtCO2/MMft3 (20)
Now, Eq. 21 can be used to estimate the annual CO2 emissions from the reforming section:
19.9 (MtCO2/MMft3)× 131 MMft3d × 340 (d/yr) = 886 × 103 MtCO2/yr (21)
This corresponds to 0.5 kg CO2/kg methanol, which is comparable to the 0.4 CO2 kg CO2/kg methanol reported in the literature.19
Takeaway. This work has introduced shortcut approaches for the rapid selection of reforming technologies and order-of-magnitude correlations to estimate the cost and CO2 emissions of the reforming unit. These correlations can be used for the preliminary screening of different pathways for syngas production. More than 350 chemical (GTL, methanol, and ammonia) plants were surveyed, and their cost data were analyzed to determine the cost correlation that can be used to estimate the cost of the reforming unit based on two simple inputs: the natural gas feed capacity and the required H2/CO ratio. The same two inputs can be used to determine the CO2 intensity of the reformer. The simplicity of the correlations and selection approach can provide significant guidelines to the designer during the initial stages of the project. Nonetheless, since the cost equations are order-of-magnitude estimates, care must be given to perform a more detailed analysis once the preliminary decisions have been made. GP
LITERATURE CITED
- Ahluwalia, R. K., T. Q. Hua, J. K. Peng and R. Kumar, “System level analysis of hydrogen storage options,” U.S. DOE Hydrogen Program Annual Merit Review, 2011.
- Rostrup-Nielsen, J. R. and T. Rostrup-Nielsen, “Large-scale hydrogen production,” Cattech, Vol. 6, 2002.
- Maitlis, P. M. and A. de Klerk, “Greener Fischer-Tropsch processes: For fuels and feedstocks,” John Wiley & Sons, 2013.
- Rostrup-Nielsen, J. and L. J. Christiansen, Concepts in syngas manufacture, Imperial College Press, London, June 2011.
- Zhang, C. and M. M. El-Halwagi, “Estimate the capital cost of shale-gas monetization projects,” Chemical Engineering Progress, Vol. 113, 2017.
- López-Molina, A., D. Sengupta, C. Shi, E. Aldamigh, M. Alandejani, and M. M. El-Halwagi, “An integrated approach to the design of centralized and decentralized biorefineries with environmental, safety, and economic objectives,” Processes, Vol. 8, Iss. 12, 2020.
- El-Halwagi, M. M., “Sustainable design through process integration: Fundamentals and applications to industrial pollution prevention, resource conservation, and profitability enhancement,” Butterworth-Heinemann, August 2017.
- Rothwell, G., “Cost contingency as the standard deviation of the cost estimate,” COST ENGINEERING, Vol. 47, 2005.
- “Economic Indicators,” Chemical Engineering, Vol. 129, 2022.
- “High-efficiency methanol process technologies,” Haldor Topsoe, 2022, online: https://www.topsoe.com/processes/methanol
- “SynCOR Ammonia™—New process for grassroots plants,” Haldor Topsoe, 2022, online: https://www.topsoe.com/products/process-licensing/syncor-ammoniatm-new-process-for-grassroots-plants?hsLang=en
- “Pearl GTL—Overview,” Shell, 2022, online: https://www.shell.com/about-us/major-projects/pearl-gtl/pearl-gtl-an-overview.html
- “Best available techniques for the manufacture of large volume inorganic chemicals—Ammonia, Acids and Fertilisers,” European Commission, August 2007.
- Klerk, A. d., Fischer-Tropsch refining, 1st Ed., John Wiley & Sons, 2012.
- Rostrup-Nielsen, J. R., “New aspects of syngas production and use,” Catalysis TODAY, Vol. 63, 2000.
- Cloete, S., M. N. Khan, S. M. Nazir and S. Amini, “Cost-effective clean ammonia production using membrane-assisted autothermal reforming,” Chemical Engineering Journal, Vol. 404, 2021.
- Chen, G., “Calculate the power of cryogenic air separation units,” Chemical Engineering Progress, Vol. 116, 2020.
- Afzal, S., D. Sengupta, A. Sarkar, M. El-Halwagi and N. Elbashir, “Optimization approach to the reduction of CO2 emissions for syngas production involving dry reforming,” ACS Sustainable Chemistry & Engineering, April2018.
- Al-Breiki, M. and Y. Bicer, “Comparative life cycle assessment of sustainable energy carriers including production, storage, overseas transport and utilization,” Journal of Cleaner Production, Vol. 279, January 2021.
 |
ABDULRAHMAN S. ALSUHAIBANI holds a PhD in chemical engineering from Texas A&M University. His research interest is in the area of sustainable design of industrial systems, including the production of low-carbon alternative fuels. Prior to earning his PhD, Dr. Alsuhaibani worked for Saudi Aramco R&DC.
 |
SHAIK AFZAL is a Principal Engineer in the Hydrogen Technology Center at GTI Energy. He is involved in projects for low-carbon production and the utilization of hydrogen for various downstream applications. Dr. Afzal’s past research experience is in the areas of heterogeneous catalysis, process simulation and optimization, and techno-economic analyses. He worked for 2 yr in oil refinery operations and process safety engineering in India and Qatar. He earned his B.Tech degree in chemical engineering from RV College of Engineering in India and received his MS degree and PhD in chemical engineering from Texas A&M University. Dr. Afzal did his postdoctoral training at the National Renewable Energy Laboratory.
 |
NIMIR ELBASHIR is a joint professor of Chemical Engineering and Petroleum Engineering at Texas A&M University at Qatar and the Director of Texas A&M’s Gas & Fuels Research Center.He joined Texas A&M in 2008 from the BASF Catalysts R&D department. Elbashir has more than 20 yr of research and technology development experience in catalysis, reaction engineering, fuel processing and reactor design. He has more than 10 U.S. and international patents issued in his name, including the patents for the CARGEN® technology and numerous publications in the form of peer-reviewed journal papers, books, chapters and industry reports. He has established and led many multi-million-dollar unique academia-industry collaborations, and has received numerous awards recognizing his research activities.
 |
MAHMOUD EL-HALWAGI is a professor and holder of the Bryan Research and Engineering Chair and the Managing Director of the Gas and Fuels Research Center at Texas A&M University. Dr. El-Halwagi’s main areas of expertise are sustainability, process integration, synthesis, design, operation and optimization. He is the author of three textbooks, the co-author of more than 500 referenced papers and book chapters, and the co-editor of 10 books. Dr. El-Halwagi is the recipient of several awards, including the AIChE Computing in Chemical Engineering Award and the AIChE Sustainable Engineering Forum Research Excellence Award. He earned his BS and MS degrees from Cairo University and his PhD from the University of California, Los Angeles.
Appendix: Sources of information for the applications listed in TABLE 1.
|
Plant
|
Reference(s)
|
|
|
A1 |
First Commercial Gas-to-Liquids Plant Starts in Qatar. Joseph Lohan. 2004.- https://www.icis.com/explore/resources/news/2006/06/06/1068098/first-commercial-gas-to-liquids-plant-starts-in-qatar/
Air Products Brings Oxygen Onstream and on Schedule for Oryx GTL. 2006. https://investors.airproducts.com/news-releases/news-release-details/air-products-brings-oxygen-onstream-and-schedule-oryx-gtl Evaluation of Small-Scale Gas-to-Liquid Economic Feasibility to Mitigate North Dakota Flaring Issue. Pascoela da Silva Sequeira and Rouzbeh Ghanbarnezhad Moghanloo. 2019.https://www.onepetro.org/conference-paper/SPE-195209-MS |
|
|
A2 |
Air Separation Plants - History and Technological Progress in the Course of Time. 2019.https://www.linde-engineering.com/en/images/Air-separation-plants-history-and-technological-progress-2019_tcm19-457349.pdf
Evaluation of Small-Scale Gas-to-Liquid Economic Feasibility to Mitigate North Dakota Flaring Issue. Pascoela da Silva Sequeira and Rouzbeh Ghanbarnezhad Moghanloo. 2019.https://www.onepetro.org/conference-paper/SPE-195209-MS |
|
|
A3 |
Escravos Gas-to-Liquids Project, Niger Delta.https://www.hydrocarbons-technology.com/projects/escravos/
Air Products to Supply Units with Chevron Nigeria. Joseph Lohan. 2006.https://www.icis.com/explore/resources/news/2006/06/29/1073458/air-products-to-supply-units-with-chevron-nigeria/ Evaluation of Small-Scale Gas-to-Liquid Economic Feasibility to Mitigate North Dakota Flaring Issue. Pascoela da Silva Sequeira and Rouzbeh Ghanbarnezhad Moghanloo. 2019.https://www.onepetro.org/conference-paper/SPE-195209-MS |
|


Comments