
LPG plant revamp to increase capacity, produce commercial-grade propane—Part 1
S. Ammar, El-Wastani Petroleum Co., Cairo, Egypt and F. Khalifa, Suez University, Suez, Egypt
The growth in the natural gas industry has reached the point where it will increase faster than any other primary energy source, due to its clear-burning characteristics and its ability to help meet environmental requirements.1,2 The share of natural gas in world energy use is anticipated to increase to 30% by 2020. Although the primary use of natural gas is fuel, it is also a major source of hydrocarbons for petrochemical feedstock.
Natural gas is the primary energy resource in Egypt, superseding oil reserves. Gas is expected to become more and more important to the energy future of Egypt, as strong potential for additional discoveries exists, especially in the Western Desert, the Nile Delta and offshore in the Mediterranean Sea.
This article investigates, analyzes and evaluates the different modifications needed to retrofit the El-Wastani LPG plant in Egypt to enhance LPG recovery percentage and to produce an additional product—commercial propane—with high propane recovery percentage. The retrofit also seeks to increase the plant’s handling capacity from 160 MMscfd to 200 MMscfd. To accomplish these two goals, a change in the existing process configuration and in several operating conditions and equipment sizing have been studied.
The simulation used in this study to examine the existing and proposed modification was produced by proprietary software using the Peng-Robinson equation of state (EOS). The simulation of the existing LPG plant resulted in a better understanding of the design margins than those provided by the original designer.
The debottlenecking study also showed that the proposed modifications to the plant can increase butane recovery from 80% to 95% and propane recovery to 92.5%. Furthermore, the modified process can handle 200 MMscfd of raw gas, up from 160 MMscfd.
The last section of this study considers the economic perspective and the return on investment (ROI) calculated for both options:
- Revamp the plant to produce commercial propane, keeping the same design handling capacity and improving the butane extraction percentage. ROI will be paid back within 4.5 months (as calculated using the ROI score method).
- Modify the plant to handle 200 MMscfd of raw gas and increase the LPG recovery from 80% to 94%. ROI will be paid back within five months.
LPG plant characteristics. The recovery of light hydrocarbon liquids from natural gas streams3 can range from simple dewpoint control to deep ethane extraction. The desired degree of liquid recovery has a profound effect on process selection, complexity and cost of the processing facility. Gas composition has a major impact on NGL economics and recovery.
In general, gas with a greater quantity of liquefiable hydrocarbon produces a greater volume of product. Richer gas also entails greater refrigeration duties, larger heat exchangers and higher capital costs for a given recovery efficiency. Leaner gases generally require more severe, low-temperature processing conditions to achieve high recovery efficiency.4
In fractionation plants, LPG processing trains comprise a deethanizer, a depropanizer and a debutanizer.5,6 New process configurations are being brought to the market to take advantage of other liquids separation pathways, such as gas expansion (using expansion valves) and turboexpanders.
This work studies the proposed addition of a depropanizer column to the plant to produce commercial propane. Other modifications would allow the plant to handle 200 MMscfd of gas. The retrofit proposal includes changes to plant processes and equipment. An economic evaluation for the retrofit will be presented in Part 2.
Overview of existing LPG plant. El-Wastani Petroleum Co. (WASCO) owns and operates the El-Wastani network of wells and gathering systems in Egypt’s Nile Delta. The gas streams from the wells are directed to a central processing facility (CPF) located at the El Wastani-1 (EW1) wellsite. The CPF was built in three phases:
- Phase 1 included a separation facility to separate approximately 40 MMscfd of gas from water and condensate
- Phase 2 added a 150-MMscfd Joule-Thompson (J-T) plant and sales gas compressors to compress gas for Egypt’s national gas network
- Phase 3 saw an expansion of the J-T plant to 160 MMscfd, with mechanical refrigeration and condensate stabilization units added for first-stage operations, followed by a turboexpander and an LPG liquid recovery train with a deethanizer and a debutanizer for second-stage operations.
Phases 1 and 2 were commissioned in 2006 and utilized the sales gas compression provided in Phase 2. The Phase 3 project was originally designed to process 160 MMscfd of feed gas and 4 Mbpd of raw condensate to produce 245 tpd of LPG product for the local market, 5 Mbpd of stabilized condensate and 153 MMscfd of sales gas for the Egyptian national grid.
The Phase 3 LPG processing facilities are segregated into two stages, as detailed below:
- Stage 1 was commissioned in October 2006 and was designed to produce sales gas and stabilized condensate product as required for pipeline transport specifications. The process equipment installed in Stage 1 included a gas dewpoint-decreasing facility with a mechanical refrigeration unit (MRU), a glycol injection and regeneration unit, and a condensate stabilization unit. Stage I processes 160 MMscfd of feed gas and 4 Mbpd of raw condensate to produce 157 MMscfd of processed gas at 32°F cricondentherm (hydrocarbon dewpoint), and 5 Mbpd of stabilized condensate at a maximum Reid vapor pressure (RVP) of 10 psia. Condensate storage and associated utilities were also installed during Stage 1 construction.
- Stage 2 was commissioned in December 2006 and was designed to produce LPG with 80% butane recovery. The process equipment installed in Stage 2 included a molecular sieve dehydration unit, a turboexpander, deethanizer and debutanizer fractionation towers, and LPG storage bullets. Stage 2 was designed to produce 245 tpd of LPG, 5 Mbpd of stabilized condensate with an RVP of 6 psia, and 153 MMscfd of sales gas.
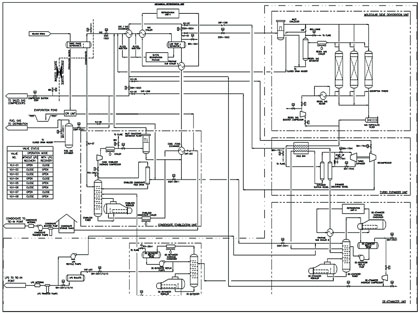
Process description of existing LPG plant. A simplified process block diagram for the plant is shown in Fig. 1. The combined incoming feed gas streams from El-Wastani wells and other gas wells are routed to two groups of three-phase separators connected in parallel. Each separator is designed to handle 80 MMscfd of gas.
 |
|
Fig. 1. Flow diagram for the existing LPG plant. |
Gas from the group separators normally goes to Stage 1 of the Phase 3 operation; however, this gas could also be diverted to an existing 150-MMscfd J-T plant when the need arises. In the latter case, the hydrocarbon liquids separated in the J-T plant are sent to the condensate stabilization unit, and the separated gas from the J-T plant is sent to compression, and then on to the natural gas grid.
In normal Phase 3 operation, the gas from the group separators goes through Stage 1 of the Phase 3 plant, which consists of an MRU-low-temperature-separator (MTU-LTS) unit that uses propane as a pure refrigerant to exchange heat with the inlet gas to decrease its temperature to –10°C. Then, the cold gas enters the LTS, where it is separated into three streams: gas, condensate and glycol. The glycol is injected upstream of the gas/gas exchanger and upstream of the gas chiller to capture any condensed water for hydrate inhibition. The unit controls sales gas quality and also recovers additional hydrocarbon liquids.
The condensate liquid from the feed gas group separators is sent to the condensate stabilization unit (CSU). Hydrocarbon liquids from the MRU-LTS unit can be sent to either the CSU or to the deethanizer tower in Stage 2 of the Phase 3 plant for LPG recovery. This process involves a gas/gas exchanger and a mechanical refrigeration unit. Also, gas hydrate formation is inhibited by injecting glycol into the gas stream prior to cooling. Gas from this stage goes to Stage 2 of the Phase 3 plant for additional liquids recovery.
Gas from the MRU and LTS goes to Stage 2 of the Phase 3 plant and is dried by molecular sieve in the dehydration unit. The dried gas is sent for further chilling across a cryogenic heat exchanger (cold box), and then to a turboexpander for more hydrocarbon liquids recovery. The cold gas is also used to cool the dried gas coming into the cold box, which is then sent to the gas/gas heat exchanger of the MRU-LTS unit to precool the gas going into the MRU gas chiller. It is then recompressed in the turboexpander to boost its pressure for the sales gas compressors.
Hydrocarbon liquids from the MRU-LTS unit and the turboexpander are fed to the deethanizer tower. The ethane-free deethanizer bottoms liquid goes to the debutanizer tower, where the LPG is recovered as the top product of the debutanizer tower.
Regeneration gas from the dehydration unit and the deethanizer overhead gas is separately compressed on the same engine that was used to regenerate the molecular sieve towers. The regeneration gas is then sent back to the MRU-LTS at the feed gas inlet and joins the sales gas feed to the sales gas compressors. Liquid bottoms from the debutanizer tower are sent to the stabilizer tower in the CSU unit and recovered as condensate product.
Water from the feed gas group separators is sent to the corrugated plate interceptor (CPI) unit and then to the evaporation pond or, alternatively, to the produced water storage tank for disposal.
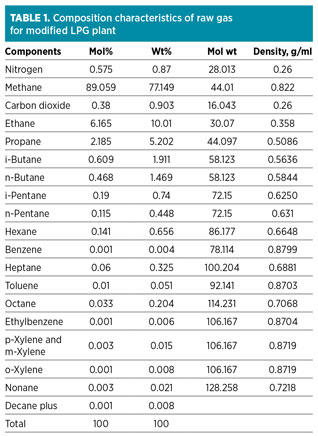
Results and discussion. The modifications considered for the El-Wastani LPG were proposed to increase propane percentage recovery and to accommodate a higher capacity of raw gas with the composition characteristics shown in Table 1.
Modeling the existing plant. A model of the plant was built using proprietary software with the conditions of 160 MMscfd of raw gas flow from the wells and 4 Mbpd of condensate flow from the wells.
The model results were then compared with actual design and production data, which showed that the model provides a good match with both design and historical production data. Therefore, the decision was made to base the retrofit process on the static model as the best representation of the actual plant.
An economic feasibility study was carried out for the proposed modifications to provide management with the facts necessary to make an investment decision. The proposed modifications and specifications for the feasibility study are shown in Tables 2 and 3, which tabulate sales gas product and LPG specifications.
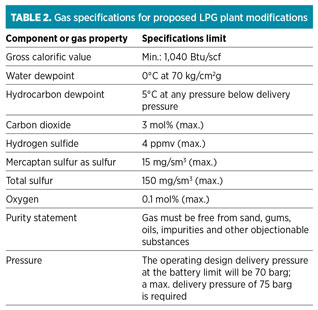
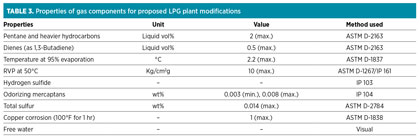
Table 4 tabulates total capital investment (TCI) for the existing LPG plant. TCI designates the amount of funds needed to design, build and operate the plant, and is calculated from the sum of fixed capital and working capital.

All costs related to products manufacturing process were calculated to be $146,725,508 using the following simplified model1 for estimating operating cost shown in Eq. 1:
Total operating cost (TOC) = 1.11 (Raw material + Utility cost) +(1) 0.183 (Total fixed cost) + 0.028 (Sales)
Since raw material costs = (10% – 50%) TOC, then utilities costs = (10% – 20%) TOC. Therefore, total operating expenses can be estimated by the simplified model shown in Eq. 2:
Total estimated operating cost = [0.183 (Total fixed cost) + 0.028 (Sales)] ÷ (2) 0.223 = $146,725,508
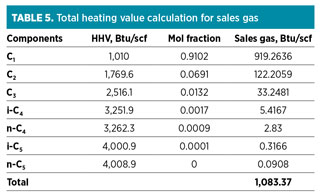
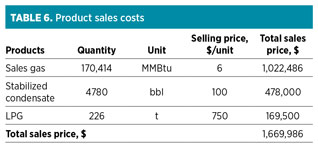
Total revenue estimation. The total sales revenues are estimated according to the products sales cost. The sales gas higher heating value (Btu/scf) calculation is shown in Table 5. The product quantities were gathered from the simulation of the existing LPG plant. Table 6 summarizes all product sales costs. The total annual sales revenue is calculated as $601,195,047.
Profit calculation. The gross profit before depreciation ($454,469,539) is equal to the total sales revenue ($601,195,047) minus the total product cost ($146,725,508).
The straight-line and declining-balance methods, in which a fixed-percentage factor of the property value each year, f, is used to calculate the depreciation cost for the process equipment for the first year.
Total PEC is $24,803,009. After n years, the salvage value follows the formula shown in Eq. 3:
Vs=Vi (1 – f) × n (3)
where:
Vs=Value of equipment after years
N=Number of years
Vi=Initial PEC
F=Depreciation factor, f = 0.2.
The value for the process equipment after one year is $19,842,407.
Using the straight-line method, depreciation cost, D, can be calculated as shown in Eq. 4:
(Vi – Vs ) ÷ n (4)
Depreciation cost1 for process equipment after one year was calculated to be $4,960,602. The gross profit ($449,508,937) is equal to the gross profit before depreciation ($454,469,539) minus depreciation costs ($4,960,602), assuming local taxes of 30%. Therefore, the annual net profit after taxes is calculated to be $314,656,256.
ROI is equal to the net profit after taxes multiplied by 100. In this case, ROI was calculated at 290%. The payback period was calculated to be 4.5 months. Fig. 2 illustrates the cash flow for the existing LPG plant after 1 yr of operation.
 |
|
Fig. 2. Cash flow diagram for existing LPG plant after 1 yr |
Part 2 of this article, to be published in the January/February 2017 issue, will present an economic evaluation for retrofitting the existing plant to maximize LPG recovery and produce commercial-grade propane. GP
LITERATURE CITED
- BP, “BP statistical review of world energy,” June 2011.
- Poe, W. A., S. Mokhatab and J. G. Speight, Handbook of Natural Gas Transmission and Processing, 2nd Ed., Elsevier, Amsterdam, the Netherlands, 2012.
- Kidnay, A., W. R. Parrish and D. G. McCartney, Fundamentals of Natural Gas Processing, CRC Press, Boca Raton, Florida, 2006.
- Beggs, H. D., Gas Production Operations, Oil & Gas Consultants International, Tulsa, Oklahoma, 2002.
- Baasel, W. D., Preliminary Chemical Engineering Plant Design, 2nd Ed., Springer Science+Business Media, Berlin, Germany, 1989.
- Sinnott, R. K., Chemical Engineering Design, 4th Ed., Elsevier, Amsterdam, the Netherlands, 2005.
Sayed Ammar has worked as a process engineer at WASCO in Egypt since 2009. He has participated in the design review, commissioning and startup of several gas processing projects. He holds a BSc degree in petroleum engineering from Suez Canal University in Egypt.
Fatma Khalifa is a professor of chemical engineering at Suez University, in the chemical engineering and petroleum refinery department. She teaches courses on natural gas processing and production, conversion processes, petrochemicals and unit operation. Dr. Khalifa has supervised several MSc degree and PhD theses, and she is the author of more than 100 technical papers on oil and gas. She holds a PhD in chemical engineering from Suez University in Egypt.


Comments