
Evaluate GTL processes compared with conventional refining
R. Uberman, A. F. Modrzewski Kraków Academy, Kraków, Poland; and S. Žiković, University of Rijeka, Rijeka, Croatia
Many attempts have been made to develop a process allowing for the substitution of crude oil with another feedstock capable of delivering high-quality fuel products. This quest is inevitably linked to the names of Fisher and Tropsch, who successfully developed and patented a process to convert a mixture of carbon monoxide and hydrogen into liquid hydrocarbons.
This process was first applied commercially during World War 2 (WW2). For a long time after the war, the only country where the development of Fischer-Tropsch (FT) technology took place was South Africa. Oil majors did make some effort to improve GTL technology, but they treated it primarily as a long-term optional investment without immediate application plans.
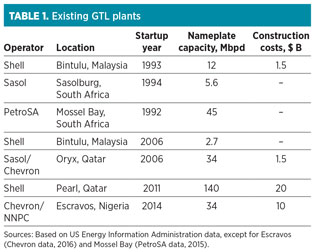
The company credited for rejuvenating the FT concept was Shell, with its Pearl project in Qatar. This plant utilizes an improved, proprietary version of Fischer-Tropsch synthesis that was first tested in the Bintulu refinery in Malaysia.
Seven GTL plants are in operation worldwide, but only the Pearl installation is considered a truly operational full-scale project, with a nameplate capacity of 140 Mbpd (Table 1). The other, smaller plants include two Shell plants in Malaysia, Sasol’s plant in South Africa, and a JV between Sasol and Chevron in Qatar. Chevron also operates a plant in Nigeria. Due to the 2015 downturn in oil prices, other proposed GTL plants have been put on hold.
 |
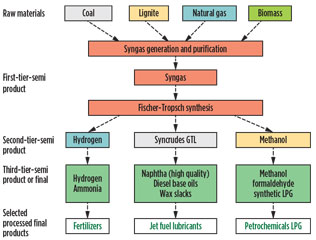
Fundamentals and GTL key products. FT technology typically has four components: synthesis gas (syngas) generation, gas purification, FT synthesis and product upgrading. The third stage constitutes a distinctive technology that provided the basis for future technological developments and innovations.
The remaining three technologies were well-known before FT invention, and have been developed separately. The syngas generation and purification steps are needed to create the syngas suitable for synthesis. Their scope and characteristics are determined by the primary feedstock—traditionally, lignite coal (Fig. 1). The syngas is normally produced via high-temperature gasification in the presence of oxygen and steam.1 The air separation unit typically represents a considerable CAPEX investment.
 |
|
Fig. 1. The GTL value chain. |
Researchers recommended autothermal reforming (sometimes in combination with steam) as the best option for syngas generation. FT synthesis is driven by the desired final products portfolio. Depending on the portfolio mix, either low-temperature (200°C–240°C) or high-temperature (300°C–350°C) synthesis is used, with further differentiations achieved by catalysts.
In general, low temperatures yield high-molecular-mass linear waxes, while high temperatures produce gasoline and low-molecular-mass olefins. Product upgrading is usually achieved with a combination of typical refining processes such as hydrotreating, hydrocracking and hydroisomerization, as well as with applicable product separation and blending.
Although the products portfolio resulting from GTL processes mirrors that coming from a typical refinery, some significant differences are present and they tend to play in GTL’s favor. GTL will typically yield significantly more middle distillates and slightly more light fractions at the expense of heavy distillates.2
This difference is positively correlated with oil gravity and sulfur content, as the biggest difference refers to the processing of heavy sour grades of crude. In the present market and demand structure, this difference is increasingly important. Prevailing trends on the demand side of the oil market gradually increase the attractiveness of GTL technology, as refineries face a growing challenge to satisfy customer demand for diesel.
Moreover, heavy distillates are under slow but relentless conversion from a market product status to an unwelcome semi-product. This development comes from two sides. On one hand, the demand for heavy fuel oil and asphalt is decreasing due to environmental concerns and a lack of huge infrastructure projects; on the other hand, oils available on the market tend to be heavier, on average. On the negative side, GTL technology is still a fringe niche. It is cumbered by huge capital costs and high energy intensity. To overcome some of the main challenges, research and development must address the following issues:3
- Capital cost reduction, since, even by energy and refinery standards, FT is a very capital-intensive technology
- Expanded feedstock base through the development of efficient, lowest-cost gasification technologies for biomass, coal, etc.
- Improved catalyst selectivity and lifetime.
Competitive position of gas feedstock for refineries. A number of studies have attempted to evaluate the economic attractiveness of GTL technologies.1,3,4 As in the case of any investment, four major parameters determine the economic viability of GTL technology:
- Capital expenditures
- Feedstock costs
- Processing costs
- Product values.
All of these parameters must be considered over a long time frame covering 20–40 years (the investment process alone typically covers a 5–10-year span). GTL projects (excluding mini-GTL) are one of the most expensive undertakings, globally. The Pearl project is believed to have cost close to $20 B and, as such, is probably a record among downstream greenfield investments.
The common estimates range between $50 Mbpd and $200 Mbpd, as measured by the final products output.2 To compare, Kuwait Oil Co. is working on a new refinery scheduled to open in 2018 with exactly the same cost estimates as the Pearl GTL plant, but double the capacity—615 Mbpd. As GTL is still a nascent technology, it is believable that the experience curve will lead to a reduction in this burden in the future. However, it is unlikely that GTL plants will ever cost less than traditional refineries, since FT technology requires more installations.
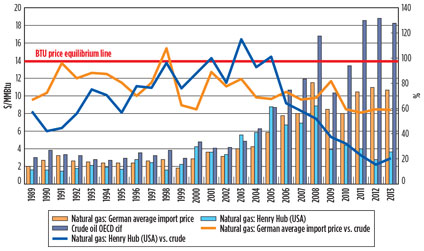
On the supply side of the equation, the key factor determining GTL attractiveness is the price differential between crude oil and natural gas. This differential is shown in Fig. 2.
 |
|
Fig. 2. Historical relation of crude oil and natural gas prices. On the right axis, |
Natural gas prices in developed markets were continuously high until 2006, creating an immense barrier for GTL technology commercial application (Fig. 2). After 2006, due to the shale gas revolution and an expansion of NGL processing technology, the gap between natural gas and crude oil prices widened, primarily in the US.
In Europe, this gap was much less pronounced due to the non-existence of the shale industry and dependence on imported gas. Imports are mainly regulated by long-term contracts based on crude oil-related price formulas; however, this pattern is undergoing significant change.5 In the long term, the US price differential is probably untenable due to the lifted export restrictions and to the further development of LNG projects, which will bring US domestic prices closer to European and Asian levels.
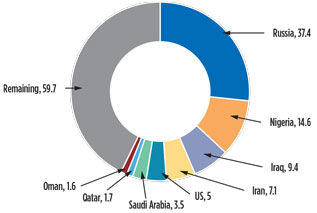
Another factor that must be taken into account is the potential for tapping available streams of flared gas (Fig. 3). Flaring represents an increasing burden for the oil and gas industry, as seen with the “Zero Routine Flaring by 2030” initiative launched in April 2015 by the United Nations and the World Bank.6
 |
|
Fig. 3. Volumes of gas flared in Bcm, 2011. Source: World |
As previously mentioned, on the product side, two main factors play in favor of GTL technology, as compared to conventional refinery processes:
- A higher share of middle distillates
- Better quality of product, especially base oils.
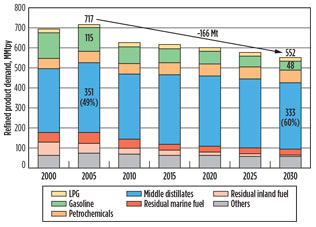
In Europe, most oil refineries were constructed after WW2. They were originally optimized to maximize gasoline output, at the expense of middle distillates. However, in the 1980s, diesel began to be favored as a personal vehicle fuel, creating a growing mismatch with the supply side. European refineries were long on gasoline and short on diesel, requiring them to export gasoline across the Atlantic Ocean, while imported diesel gained a significant share of the market (Fig. 4).4
 |
|
Fig. 4. Total demand for petroleum products in the EU-27, |
Another fundamental challenge faced by European refineries is that, due to environmental regulations, heavy feed slates (primarily asphalts and heavy fuel oils) are increasingly difficult to market and, therefore, become unwanted residues rather than revenue generators. GTL technology has a clear advantage here due to its complete lack of heavy slates. This may become a strong argument for GTL in the future, especially for FT installations within existing refineries that can be used to increase the share of light and middle distillates in the overall product portfolio.
GTL products are often claimed to be superior to their crude-based equivalents. A study found that GTL diesel has outperformed B5 diesel in various dimensions; GTL showed a maximum increase in power and brake thermal efficiency, up to 10.1% and 21%, respectively, compared to B5 diesel. GTL also showed good improvement in brake-specific fuel consumption by lowering the value approximately 9.29% compared to B5 diesel (Fig. 5).
 |
|
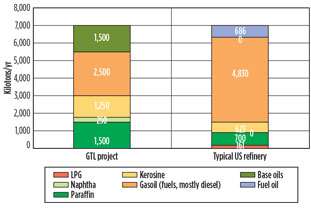
Fig. 5. Assumed GTL product slate, as opposed to a typical |
Exhaust emissions experiments revealed an overall significant reduction of CO (22%–25%), hydrocarbons (30%–40%) and NOx (6% to 8%).7 GTL diesel has the potential to be sold as a premium blendstock. In addition, FT diesel can be blended with lower-cetane, lower-quality diesels to achieve commercial diesel specifications. Attractive results are also proclaimed for GTL Group III base oils showing superior viscosity and a lack of sulfur.8 Shell also advertises GTL naphtha attractiveness, stating that it gives superior yields to conventional naphtha.9
Financial assessment of a GTL project. As the Pearl project stands above other GTL plants both in terms of size and product portfolio, it probably best represents the commercial potential of FT technology. Moreover, with 7,000 kilotons of crude equivalent throughput, it mirrors the size of financially viable classical refineries.
Therefore, financial modeling was performed assuming a similar size and product portfolio to evaluate general GTL commercial viability. To avoid speculations about forecasts, the model was built using real historical data and assuming that the theoretical plant started production on January 1, 2008.
 |
|
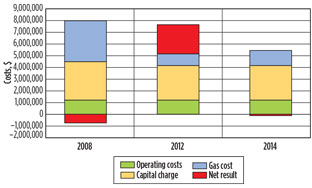
Fig. 6. Estimated financial results of a 140-Mbpd GTL project. |
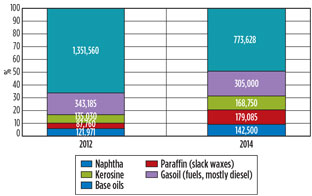
The results indicate that only very favorable quotations, like those from 2012, can allow such a large-scale GTL project to be financially viable (Fig. 6). In other historical circumstances, the quotations cannot even cover capital charges. It may come as a surprise that as far as gains from better product quality are concerned, base oils (used for lubricant manufacturing) play a crucial role (see Fig. 7). Lubricants are usually considered a niche product, accounting for less than 1% of total output.
 |
|
Fig. 7. Gross margin above crude oil of GTL slates, based on |
Fig. 6 presents the results of the financial model representing key variables of the artificial GTL project, based on the following assumptions:
- Volume and slates structure are set according to the Shell presentations.9
- Product quotations are obtained from several oil companies (Sasol, PKN Orlen, MOL).
- Gas prices reflect Canadian export prices, as published by BP in 2014, to mirror prices pertinent to areas where natural gas is abundant and distant from potential markets.
- Operational costs (including water, oxygen, labor, maintenance, insurance, etc.) vary between studies, but are usually in a $15/bbl–$25/bbl range.3 Based on the selling price of the commodities and other costs, operational costs were placed near the higher end of the estimate.
- The discount rate is set to an equal-to-average return on equity, as published by Damodaran and increased by a 6% project risk premium.
- Investment expenditures are set at $20 B.
- Net results are set as the gross profit minus the capital charge.
To clarify this issue, the history of developments in the base oils sector can be consulted. Until the 1970s, all lubricants were made from Group I base oils and additives. The base oils were obtained by processing selected middle distillates. In the late 1970s, Chevron, followed by others, introduced hydrocracker bottom residues as an alternative feedstock for obtaining better-quality semi-product. The process had to be altered to accommodate feedstock changes, but it resulted in better-quality base oils falling under the Group II categorization.
When ExxonMobil introduced Mobil I, the first synthetic engine oil, it applied predominately polyalphaolefins (PAO), a product of heavy synthesis, to secure superior performance. Almost in parallel, BP and Shell began making base oils in the late 1970s from hydrocracker bottoms and waxy distillates. These oils were called “very high viscosity index” and “extra high viscosity index” base oils, and they emulated an even higher quality level. In the 1990s, Finnish refiner Neste Oil developed, at its Porvoo refinery, a process allowing for even higher-quality base oils than Group II. This process imitated the performance of PAO, but at a much lower cost. These base oils were termed Group III. Neste was followed by Malaysian Petronas and several others in the production of these higher-quality base oils. At the turn of the century, Group III base oils seemed to represent a profitable niche, with prices consistently higher than those for Group I and diesel, sometimes even by 100%.8
 |
|
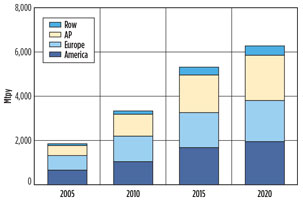
Fig. 8. Base oil Group III consumption, 2005 and 2010 |
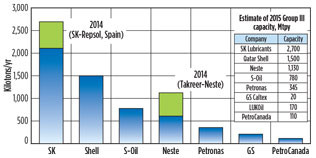
The situation in the base oils and lubricants markets evolved quickly and did not favor GTL projects. The growing use of Group III oils (Fig. 8) and their profitability created an opportunity for new entrants. New players appeared on the market, including South Korean giants SK Corp. and S-Oil Corp. They quickly adopted Chevron’s and ExxonMobil’s technologies (originally intended to produce Group II) in their largest and most modern refineries, and built capacities surpassing 1 MMt (in the case of SK, see Fig. 9).
 |
|
Fig. 9. Group III base oil capacities as of 2013. Source: |
Since crude-based Group III base oils have become a sort of a hydrocracking byproduct and the demand for lubricants has been stagnant, the premium over diesel has narrowed to as little as 10%–15%. GTL base oils are not quoted separately, so it can be difficult to assess the exact premium they claim. However, as the only GTL base oils user, Shell has not significantly improved its position, so it is safe to assume that the supposed market values of GTL base oils cannot be estimated substantially above those of competitors.
This unfavorable situation in the base oils markets is expected to persist, since demand is not expected to significantly increase and since hydrocracking capacities keep expanding. These expanding capacities maintain the status of base oils as the most attractive application of bottom residues, even at low prices.
On what does the success of GTL depend? GTL is one of a growing group of technologies where the economic feasibility depends on the gas-to-oil price ratio. Although it is usually assumed that prices for gas and WTI are highly correlated and integrated, this relationship is not reliable, strong or linear.10
Past relationships between prices for gas and WTI may not be a reliable predictor of future natural gas prices—at least, not over the long term, as shifts in underlying market forces are unpredictable. Findings run counter to the assumptions used in financial evaluations of GTL projects.3 It remains to be seen if areas will emerge with significant surpluses of natural gas, and if they will logistically detach from markets so that a 1:5 price-per-Btu ratio will justify a full-scale GTL plant.
It is clear that scaling down CAPEX and OPEX is necessary to make the technology economically attractive. If new projects are to be implemented, then the accumulated experience can be expected to push the learning curve. Another natural option is to develop GTL as an upgrade of proven refinery operations, rather than a greenfield project. Various advantages exist for supplementing an existing plant with an FT unit, such as the potential availability of CO2, the use of a hydrocracker for upgrading and the availability of existing utilities, offsites and services.
According to Fluor, “If syngas production, a hydrocracker and services are available, then total investment cost can be reduced by 75%.”11 Also, it is reasonable to expect that climate regulations will continue to support technologies that lead to a diminished share of heavy feed slates.
The presented analysis indicates, based on the model analyzed, that a different factor may prove to be decisive in an individual case. If the market recognizes the superior quality of a given GTL product and remunerates it by a premium over the oil-based ones, then the whole project (and the technology, in general) may gain a new momentum. Although an attempt with Group III base oils does not seem successful, the path of searching for niche-based advantages looks to be set. GTL is, and can continue to be, successfully challenged in the transportation area by fuels based directly on natural gas, such as LPP and CNG. However, their application would require significant changes to engines, if not new engines. Analysis of this issue falls beyond this article’s scope.
GTL technology, if successfully implemented, may cause another revolution in the energy industry, leading to the elimination of crude oil as a key feedstock. In 2016, such a scenario looks improbable due to falling oil prices. In December 2013, Shell cancelled plans to build a large-scale GTL facility in Louisiana due to high capital costs and market uncertainty regarding natural gas and petroleum product prices.
The US Energy Information Administration’s Annual Energy Outlook 2014 reference case projection does not include any large-scale GTL facilities in the US through 2040.12 At the present time, other uses for available natural gas in industry, electric power generation and exports via pipeline and LNG are considered to be more economically attractive than GTL.13 GP
Acknowledgment
Financial support from the Croatian Science Foundation, grant No. IP-2013-11-2203, is gratefully acknowledged.
Literature cited
1Spath, P. L. and D. C. Dayton, “Preliminary screening—technical and economic assessment of synthesis gas to fuels and chemicals with emphasis on the potential for biomass-derived syngas,” National Renewable Energy Laboratory, Golden, Colorado, 2003.
2Wood, D. A., C. Nwaoha and B. F. Towler, “Gas-to-liquids (GTL): A review of an industry offering several routes for monetizing natural gas,” Journal of Natural Gas Science and Engineering, Vol. 9, November 2012.
3Salehi, E., W. Nel and S. Save, “Viability of GTL for the North American gas market,” Hydrocarbon Processing, January 2013.
4Brown, C., “Gas to liquid: A viable alternative to oil-delivered transport fuels?” The Oxford Institute for Energy Studies, Oxford, UK, 2013.
5Franza, L., “Long-term gas import contracts in Europe,” Clingendael International Energy Program, The Hague, The Netherlands, December 2014.
6World Bank, Global Gas Flaring Reduction Partnership, 2011.
7Sajjad, H., et al., “Comparative study of biodiesel, GTL fuel and their blends in context of engine performance and exhaust emission,” Procedia Engineering, Vol. 90, 2014.
8Argus, Americas Base Oils Summit, Houston, Texas, May 2012.
9Gainsborough, M., “GTL products downstream perspectives Qatar investor visit 2009,” online: http://www.shell.com/content/dam/shell/static/investor/downloads/presentations/2009/gainsborough-qatardownstreamspeech23112009a.pdf
10Ramberg, D. J. and J. E. Parsons, “The weak tie between natural gas and oil prices,” The Energy Journal, Vol. 33, Iss. 2, 2012.
11DuBose, B., “GTL ‘14: Fluor suggests GTL units inside refineries,” Hydrocarbon Processing, July 30, 2014.
12US EIA, “Gas-to-liquids plants face challenges in the US market,” Today in Energy, February 19, 2014, http://www.eia.gov/todayinenergy/detail.cfm?id=15071
13US EIA, “Gas-to-liquid (GTL) technology assessment in support of AEO2013,” 2013.
 |
Robert Uberman earned his PhD and MSc degree from the Academy of Economics in Kraków, Poland. He also holds MBA and SDA degrees from Bocconi University in Milan, Italy. At present, he works as an independent consultant. Previously, Dr. Uberman worked as oil development director and oil controlling director at PKN Orlen. He also worked as a financial director in telecom and food companies and as a consultant in finance and strategy focusing on the mineral industry. Dr. Uberman is the author or co-author of over 30 articles and three books.
 |
Saša Žiković is on the faculty of Economics University in Rijeka, Croatia. He is the vice dean and an associate professor of finance. He is also the cofounder of the MBA program in energy economics. He works as a consultant for a number of financial institutions and software companies in the field of risk management. He has published two scientific books and 72 research papers in scientific journals. Mr. Žiković’s research interests include energy economics, risk management and volatility forecasting. Additionally, he sits on several editorial boards and is a visiting professor at a number of universities in Europe.


Comments