
Predict gas hydrate formation temperature with a simple correlation
M. Safamirzaei, Namvaran P&T Co., Tehran, Iran
Hydrate formation temperature (HFT) can be precisely predicted using a new, simple correlation. The proposed equation has been developed based on 22 data points, covering gas specific gravities from 0.55 to 1, and it has been compared to several well-known and accurate gravity models.
Additional calculations have been performed to determine the predictive capabilities of the proposed model for new data. Several experimental data points have been used to evaluate the correlation performance for natural gas mixtures, and accurate predictions have confirmed the reliability of the proposed correlation.
The average relative deviation (ARD) for predicting hydrate formation temperature of natural gas mixtures is 0.43%, for pressures up to 620 bar, which shows the suitability of the developed correlation for natural gas and similar mixtures. In addition, several experimental data points have been selected to assess the performance of the new equation for different hydrocarbon gas mixtures, including methane/ethane and propane/butane mixtures.
Although the main application of the presented correlation is related to natural gas mixtures, the proposed equation has shown reliable performance for different types of hydrocarbon gas mixtures.
All models have been evaluated based on a number of adjustable parameters, as well as on accuracy and simplicity. Despite the existence of few adjustable parameters, the new correlation is precise, particularly for natural gas mixtures.
Hydrate formation. Gas hydrates are clathrate ice-like compounds that form when light gases, such as typical components of natural gas, come into contact with water under certain conditions of temperature and pressure.1 Water molecules are linked through hydrogen bonding and create cavities that can enclose a large variety of molecules, including natural gas components.2
Gas hydrates may lead to several industrial problems, such as erosion and/or corrosion in pipelines, the blockage of transfer lines, compressor damage, etc., which cost millions of dollars in production facilities and transmission pipelines every year.3 On the other hand, innovative separation processes and storage methods based on hydrate formation/decomposition provide new opportunities for the industry.
Also, naturally occurring hydrates in the earth are regarded as a future energy resource. Consequently, gas hydrates can be regarded as both a technological problem and an opportunity. Gas hydrates have aroused significant interest within the gas and petroleum engineering, chemistry, environmental and earth sciences.2
Recently investigated topics related to gas hydrates include experimental investigations on hydrate formation conditions,2, 4–6 the effect of additives on hydrate formation,7–11 thermodynamic modeling of hydrate formation,12–15 molecular simulation of hydrate formation and prevention methods,16–18 modeling industrial problems caused by hydrate formation (especially in pipelines),19–20 CO2 hydrates,21–24 separation applications of gas hydrate formation,25 the kinetics of hydrate formation,24–27 hydrate dissociation,28, 29 etc.
In addition to time-consuming and expensive experiments, as well as complicated modeling methods, several correlations have been presented to facilitate hydrate formation prediction and interpretation.30–32 Some researchers have attempted to propose correlations to describe the relationship of pressure and temperature of gas hydrate formation with gas specific gravity.33 These kinds of correlations are popular among engineers and researchers because they are simple and fast. Some of the most important and well-known hydrate formation correlations are reviewed in the following section.
Hydrate equations. In 1934, Hammerschmidt proposed a correlation for gas hydrate formation, shown in Eq. 1:34
![]() (1)
(1)
where T and P are temperature and pressure of hydrate formation, respectively. This easy-to-use equation does not take into account the effect of gas specific gravity. Most of the proposed correlations are T-explicit because pressure is usually specified by process and/or transfer requirements, and hydrate formation temperature is the variable that should be estimated.
However, some P-explicit hydrate correlations have also been proposed. In 1981, a famous P-explicit correlation was presented by Makogon33, 35 and developed later by Elgibaly and Elkamel.36 A modified form of the Makogon correlation is presented in Eq. 2:33
![]() (2)
(2)
where:
β=2.681 – 3.811γ + 1.679γ2
k=–0.006 + 0.011γ + 0.011γ2
γ=gas specific gravity
γ=MWGas / MWAir
In 1986, Berg proposed two T-explicit correlations for 0.55 ≤ γ < 0.58 and 0.58 ≤ γ < 1 with 11 and 10 adjustable parameters, respectively.33 To provide more precise estimations of HFT, in 1987, Kobayashi et al.37 recommended a complicated T-explicit correlation made of 15 adjustable parameters. In 1991, Motiee38 suggested Eq. 3:
 (3)
(3)
This equation is well known and widely used in the oil and gas industry because of its accuracy for natural gas mixtures.
In 2000, Østergaard et al.39 presented their P-explicit correlation with 10 adjustable parameters. In addition to 10 adjustable parameters, the Østergaard method requires the mole ratio of both non-former and former components, which means that a full analysis of the gas mixture is needed.
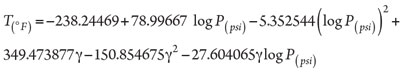
In 2005, Towler and Mokhatab40 recommended a relatively simple correlation for predicting HFT of natural gas mixtures. A modified form of this correlation is shown in Eq. 4:
![]() (4)
(4)
In 2009, Ameripour and Barrufet32 presented a correlation, containing several adjustable parameters, for estimating HFT. Beside several adjustable parameters, their correlation requires detailed analysis of gas mixtures; consequently, it is only useful when a comprehensive analysis of gas is accessible.
Zahedi et al.41 presented, in 2009, four modified correlations based on the Kobayashi et al. and Berg correlations. Although these correlations have improved the HFT predictions of the previously mentioned models, their complexity and the considerable number of adjustable parameters are regarded as disadvantages.
In 2009, Bahadori and Vuthaluru42 presented a complicated and accurate correlation for estimating HFT. The general form of their calculation is shown in Eq. 5:
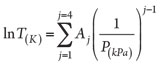 (5)
(5)
where Aj is calculated as shown in Eq. 6:
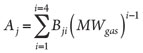 (6)
(6)
Eq. 5 has 16 adjustable parameters. The authors recommend implementing different sets of adjustable parameters, for a total of 48 parameters, for different ranges of pressure and gas molecular weight (MW).
Other researchers have implemented the artificial neural network (ANN), as an alternative for complicated equations, to correlate the HFT of natural gases.36, 41 The application of ANN is not as simple as the correlations, and it is not suitable for calculations performed by hand. There are also several graphs33, 43–45 and tabulated data,45 mostly based on the specific gravity of gas, which can be used by engineers and researchers for rapid estimations, depending on the required accuracy.
A new, simple correlation is presented here for estimating HFT as a function of gas pressure and specific gravity, and to evaluate its performance in comparison with other famous correlations for hydrocarbon gas mixtures, especially natural gas.
Model evaluation. All models, including the proposed equation in this article, have been evaluated based on the number of adjustable parameters, model accuracy and model simplicity. Adjustable parameters are used to tune correlations. Models with fewer adjustable parameters are considered to be better. Model accuracies have been evaluated according to model deviations. In this study, ARD and average absolute deviation (AAD) have been implemented to assess different models. ARD is calculated as shown in Eq. 7:
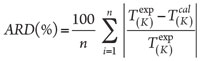 (7)
(7)
AAD is calculated from Eq. 8:
![]() (8)
(8)
where:
n,T(K)expand T(K)cal = number of data points, experimental HFT and calculated HFT, respectively.
Also, the maximum absolute deviation (Max AD) has been used to detect the highest probable deviation of models and to evaluate and compare models when ARDs and AADs do not indicate the superior model.
Model simplicity has been evaluated based on the simplicity of calculations for estimating different variables (i.e., pressure, temperature and specific gravity) by using the original correlation.
Model development and comparison. Twenty-two experimental data points used by Bahadori and Vuthaluru,42 with specific gravities from 0.55 to 1, have been implemented to develop the correlation. Eq. 9 is suitable for estimating the HFT, especially for natural gas mixtures:
![]() (9)
(9)
where:
A=194.681789
B=0.044232
C=0.189829
The ARD and AAD of the presented correlation have been calculated at 0.46% and 1.3 K, respectively. Table 1 compares the performance and number of adjustable parameters for different correlations.
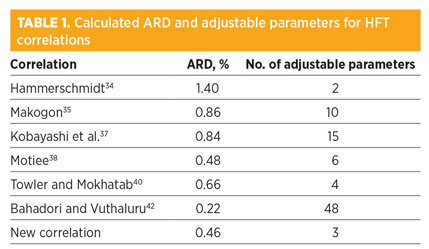 |
The new correlation (NC; i.e., Eq. 9) shows the best efficiency—low ARD and fewer adjustable parameters. The Motiee38 and Towler and Mokhatab40 correlations have proven preciseness, but they use more adjustable parameters. The NC can also be compared to the proposed correlation by Ameripour and Barrufet,32 which requires a full analysis of gas mixtures.
Although obtained results indicate the superiority of the NC, more calculations have been performed to confirm its reliability.
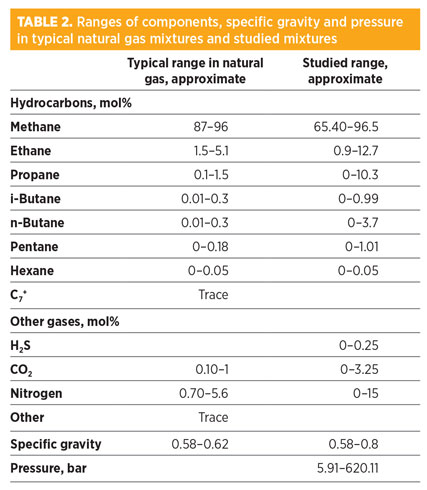 |
Model results for natural gas and similar mixtures. To assess the performance of the NC for natural gas mixtures, 125 new experimental data points for natural gas and similar compositions have been extracted from literature46 and compared to those obtained with the NC. Table 2 shows the covered ranges of components in comparison with the actual ranges of components in typical natural gas mixtures. Table 3 represents the prediction capabilities of the best correlations.
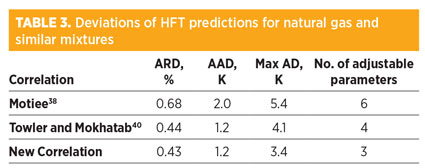 |
Deviations of the NC have been compared to well-known correlations (Motiee,38 and Towler and Mokhatab40), which showed acceptable performance and were developed for natural gas mixtures. Based on the calculated ARD, AAD, Max AD and number of adjustable parameters, the NC shows the best performance.
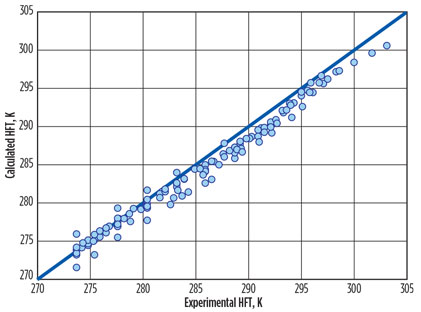
Calculated temperatures of hydrate formation by the NC are in good agreement with experimental data (Fig. 1).
 |
|
Fig. 1. Experimental HFT vs. calculated HFT via the NC for natural gas and similar |
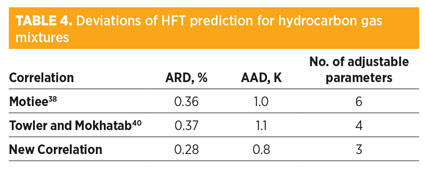
Model results for hydrocarbon gas mixtures. Forty-seven new HFT data points for hydrocarbon mixtures, tabulated by Guo and Ghalambor45 with 0.6 ≤ γ ≤ 1, have been used to evaluate the new correlation. The calculated deviations of the NC in comparison with the Motiee38 and Towler and Mokhatab40 correlations are shown in Table 4. The results reveal the superiority of the NC.
 |
Model results for propane/butane mixtures. Although the NC, like other hydrate correlations, has been tuned for natural gas mixtures and hydrocarbon mixtures with γ ≤ 1, its performance has also been evaluated for heavier hydrocarbon mixtures.
As a case study, the NC has been used to estimate the HFT of propane/butane mixtures with 1.62 ≤ γ ≤ 1.77. Results have been compared to experimental data reported by Elgibaly and Elkamel.36 The NC shows ARD of 1.04% and AAD of 2.9 K, which is regarded as a good performance for such a heavy gas mixture.
These results can be compared to estimations obtained with the Towler and Mokhatab correlation, with ARD of 1.96% and AAD of 5.4 K. Motiee’s correlation does not provide acceptable estimates for this heavy gas mixture.
Model results for methane/ethane mixtures. Several HFT data points have been used to evaluate the performance of the NC for methane/ethane mixtures with 0.56 ≤ γ ≤ 1.0336 and pure methane.45 The overall preciseness of the NC is better than other correlations.
A detailed analysis of results has revealed that Motiee’s correlation,38 in comparison with the NC, has shown better performance for methane/ethane mixtures with 1 ≤ γ ≤ 1.03 and 0.56 ≤ γ < 0.58, and pure methane. On the other hand, the performance of the NC is better for mixtures with 0.58 ≤ γ < 1.
Calculation of hydrate formation pressure. Although calculation of hydrate formation pressure (HFP) at a specified temperature with the NC is easier than with all other accurate correlations, the performance of the NC for estimating HFP is not good (ARD ≈ 20%).
Other HFT correlations have shown the same disadvantage. ARD of 20% is the typical expected deviation for HFP estimations via HFT correlations.33 In general, HFT models are not suitable for estimating the HFP; consequently, some researchers have decided to provide independent and complicated correlations for HFP calculations.32, 42 Even complicated HFP correlations may result in inaccurate results. For instance, the complicated correlation proposed by Ameripour and Barrufet,32 which requires a full analysis of gas mixtures, has shown an ARD of 16%.
Recommendations. Gas hydrate formation may cause erosion/corrosion in pipelines, transfer lines blockage, compressor damage and other industrial problems. Also, gas hydrates can be used as a new storage and separation technique to solve engineering problems. All of the aforementioned issues make gas hydrates an important subject of study for the industry. Consequently, hydrate formation conditions have been investigated by several researchers and engineers. A few correlations are used worldwide for predicting the HFT of natural gas and other hydrocarbon gas mixtures.
The accuracy of a new correlation was compared to well-known and accurate correlations. Results reveal that the NC can be used as the first choice for the prediction of the HFT of natural gas and hydrocarbon mixtures.
The performance of the NC has also been examined for heavier gas mixtures of propane and butane. The NC has shown its superiority over a wide range of gas specific gravities, especially for natural gas mixtures.
In addition to preciseness, simplicity of calculations and fewer adjustable parameters are other advantages of the proposed new HFT equation. GP
LITERATURE CITED
1Barkan, E. S. and D. A. Sheinin, “A general technique for the calculation of formation conditions of natural gas hydrates,” Fluid Phase Equilib., Vol. 86, 1993.
2Englezos, P., “Clathrate hydrates,” Ind. Eng. Chem. Res., Vol. 32, 1993.
3Safamirzaei, M. and H. Modarress, “Modeling and predicting solubility of n-alkanes in water,” Fluid Phase Equilib., Vol. 309, 2011.
4Ma, C. F., G. J. Chen, F. Wang, C. Y. Sun and M. T. Guo, “Hydrate formation of (CH4 + C2H4) and (CH4 + C3H6) gas mixtures,” Fluid Phase Equilib., Vol. 191, 2001.
5Ma, Q. L., G. J. Chen and L. W. Zhang, “Experimental and modeling study on gas hydrate formation kinetics of (methane + ethylene + tetrahydrofuran + H2O),” J. Chem. Eng. Data, Vol. 54, 2009.
6Du, J. W., D. Q. Liang, D. L. Li and X. J. Li, “Phase equilibrium data of binary hydrate in the system hydrogen + acetone + water,” J. Chem. Eng. Data, Vol. 55, 2010.
7Zhong, Y. and R. E. Rogers, “Surfactant effect on gas hydrate formation,” Chem. Eng. Sci., Vol. 55, 2000.
8Karaslaan, U. and M. Parlaktuna, “Promotion effect of polymers and surfactants on hydrate formation rate,” Energy Fuels, Vol. 16, 2002.
9Zhang, C. S., S. S. Fan, D. Q. Liang and K. H. Guo, “Effect of additives on formation of natural gas hydrate,” Fuel, Vol. 83, 2004.
10Ganji, H., M. Manteghian, K. Sadaghiani Zadeh, M. R. Omidkhah and H. Rahimi Mofrad, “Effect of different surfactants on methane hydrate formation rate, stability and storage capacity,” Fuel, Vol. 86, 2007.
11Daimaru, T., A. Yamasaki and Y. Yanagisava, “Effect of surfactant carbon chain length on hydrate formation kinetics,” J. Pet. Sci. Eng., Vol. 56, 2007.
12Duan, Z. and R. Sun, “A model to predict phase equilibrium of CH4 and CO2 clathrate hydrate in aqueous electrolyte solutions,” Am. Mineral., Vol. 91, 2006.
13Kobayashi, T. and Y. H. Mori, “Thermodynamic simulations of hydrate formation from gas mixtures in batch operations,” Energy Convers. Manage., Vol. 48, 2007.
14Chen, L. T., C. Y. Sun, G. J. Chen and Y. Q. Nie, “Thermodynamics model of predicting gas hydrate in porous media based on reaction-adsorption two-step formation mechanism,” Ind. Eng. Chem. Res., Vol. 49, 2010.
15Tavasoli, H., F. Feyzi, M. R. Dehghani and F. Alavi, “Prediction of gas hydrate formation condition in the presence of thermodynamic inhibitors with the Elliott–Suresh–Donohue equation of state,” J. Pet. Sci. Eng., Vol. 77, 2011.
16Kvamme, B., T. Kuznetsova and K. Aasolden, “Molecular dynamics simulations for selection of kinetic hydrate inhibitors,” J. Mol. Graphics Modell., Vol. 23, 2005.
17Geng, C. Y., H. Wen and H. Zhou, “Molecular simulation of the potential of methane reoccupation during the replacement of methane hydrate by CO2,” J. Phys. Chem. A, Vol. 113, 2009.
18Qi, Y., M. Ota and H. Zhang, “Molecular dynamics simulation of replacement of CH4 in hydrate with CO2,” Energy Convers. Manage., Vol. 52, 2011.
19Creek, J. L. and Z. G. Xu, “Predicting hydrate plug formation in oil-dominated flowlines,” J. Pet. Sci. Eng., Vol. 72, 2010.
20Obanijesu, E. O., M. K. Akindeju, P. Vishnu and M. O. Tade, “Modelling the natural gas pipeline internal corrosion rate resulting from hydrate formation,” Comput. Aided Chem. Eng., Vol. 29, 2011.
21Giavarini, C., F. Maccioni, M. Politi and M. L. Santarelli, “CO2 hydrate: Formation and dissociation compared to methane hydrate,” Energy Fuels, Vol. 21, 2007.
22Li, X. S., Z. M. Xia, Z. Y. Chen, K. F. Yan, G. Li and H. J. Wu, “Gas hydrate formation process for capture of carbon dioxide from fuel gas mixture,” Ind. Eng. Chem. Res., Vol. 49, 2010.
23Kim, S. M., J. D. Lee, H. J. Lee, E. K. Lee and Y. Kim, “Gas hydrate formation method to capture the carbon dioxide for pre-combustion process in IGCC plant,” Int. J. Hydrogen Energy, Vol. 36, 2011.
24He, Y., E. S. J. Rudolph, P. L. J. Zitha and M. Golombok, “Kinetics of CO2 and methane hydrate formation: An experimental analysis in the bulk phase,” Fuel, Vol. 90, 2011.
25Eslamimanesh, A., A. H. Mohammadi, D. Richon, P. Naidoo and D. Ramjugernath, “Application of gas hydrate formation in separation processes: A review of experimental studies,” J. Chem. Thermodyn., Vol. 46, 2012.
26Ribeiro, C. P. and P. L. C. Lage, “Modelling of hydrate formation kinetics: State-of-the-art and future directions,” Chem. Eng. Sci., Vol. 63, 2008.
27Kang, S. P., Y. Seo and W. Jang, “Kinetics of methane and carbon dioxide hydrate formation in silica gel pores,” Energy Fuels, Vol. 23, 2009.
28Pang, W. X., X. Y. Xu, C. Y. Sun, C. L. Zhang and G. J. Chen, “Methane hydrate dissociation experiment in a middle-sized quiescent reactor using thermal method,” Fuel, Vol. 88, 2009.
29Hiruta, A., G. T. Snyder, H. Tomaru and R. Matsumoto, “Geochemical constraints for the formation and dissociation of gas hydrate in an area of high methane flux, eastern margin of the Japan Sea,” Earth Planet Sci. Lett., Vol. 279, 2009.
30Najibi, H., A. H. Mohammadi and B. Tohidi, “Estimating the hydrate safety margin in the presence of salt and/or organic inhibitor using freezing point depression data of aqueous solutions,” Ind. Eng. Chem. Res., Vol. 45, 2006.
31Mohammadi, A. H. and D. Richon, “Use of boiling point elevation data of aqueous solutions for estimating hydrate stability zone,” Ind. Eng. Chem. Res., Vol. 46, 2007.
32Ameripour, S. and M. Barrufet, “Improved correlations predict hydrate formation pressures or temperatures for systems with or without inhibitors,” J. Can. Pet. Technol., Vol. 48, 2009.
33Carroll, J., Natural Gas Hydrates: A Guide for Engineers, 2nd Ed., Gulf Professional Publishing, Houston, Texas, 2009.
34Hammerschmidt, E. G., “Formation of gas hydrates in natural gas transmission lines,” Ind. Eng. Chem., Vol. 26, 1934.
35Makogon, Y. F., Hydrates of Hydrocarbons, PennWell, Tulsa, Oklahoma, 1997.
36Elgibaly, A. A. and A. M. Elkamel, “A new correlation for predicting hydrate formation conditions for various gas mixtures and inhibitors,” Fluid Phase Equilib., Vol. 152, 1998.
37Kobayashi, R., K. Y. Song, E. D. Sloan and H. B. Bradley, Petroleum Engineers Handbook, Society of Petroleum Engineers, 1987.
38Motiee, M., “Estimate possibility of hydrate,” Hydrocarbon Processing, Vol. 70, 1991.
39Østergaard, K. K., B. Tohidi, A. Danesh, A. C. Todd and R. W. Burgass, “A general correlation for predicting the hydrate-free zone of reservoir fluids,” SPE Prod. Facil., Vol. 15, 2000.
40Towler, B. F. and S. Mokhatab, “Quickly estimate hydrate formation conditions in natural gases,” Hydrocarbon Processing, Vol. 84, 2005.
41Zahedi, G., Z. Karami and H. Yaghoobi, “Prediction of hydrate formation temperature by both statistical models and artificial neural network approaches,” Energy Convers. Manage., Vol. 50, 2009.
42Bahadori, A. and A. Vuthaluru, “A novel correlation for estimation of hydrate forming condition of natural gases,” J. Nat. Gas. Chem., Vol. 18, 2009.
43Baillie, C. and E. Wichert, “Chart gives hydrate formation temperature for natural gas,” Oil & Gas Journal, Vol. 85, 1987.
44Gas Processors Suppliers Association, GPSA Engineering Data Book, 12th Ed., Oklahoma, 2004.
45Guo, B. and A. Ghalambor, Natural Gas Engineering Handbook, Gulf Publishing Company, Houston, Texas, 2005.
46Sloan, E. D., Clathrate Hydrates of Natural Gases, 2nd Ed., Marcel Dekker, New York, New York, 1998.
 |
Mani Safamirzaei holds a PhD in chemical engineering from Amirkabir University of Technology. He has published several scientific articles in well-known journals, mostly related to thermodynamics. Dr. Safamirzaei is a senior process engineer at Namvaran P&T and has been working at the company since its establishment. Recently, he has presented a new correlation for predicting hydrate formation temperature of natural gas and similar mixtures.


Comments