Improve the calculation of solids precipitation in gas compositions
I. Miethe, G. Lauermann and B. Jungfer, Linde AG, Pullach, Germany
The formation of solids during the cooling of natural gas streams is of high importance in gas processing, as the operational reliability of the entire plant is at stake. How can the freezing point be estimated accurately when a full analysis, including detailed data on heavier hydrocarbons, is not available?
Light hydrocarbons up to n-pentane are generally detailed in the design basis of LNG, NGL or ethane separation plants. However, heavier hydrocarbons that might clog pipes at lower temperatures are often lumped together into pseudo-components according to their boiling point.
A new method has been developed to improve the calculation of solids precipitation in natural gases. The method consists of two steps:
- Splitting the pseudo-components into four sub-fractions each: n-paraffin, P; branched paraffins, I; aromatics, A; and naphthenics, N
- Representing each sub-fraction with one discrete component; no additional physical properties need to be generated.
Data available on natural gases. Six component lists generally included in the design basis for natural gas plants are presented in Table 1. All component lists are detailed up to n-pentane. In the case of the Full component list, the heavier hydrocarbons up to n-nonane are also detailed; otherwise, pseudo-components are used instead. Components are lumped together by boiling point or, additionally, by molecular type: P, I, N or A (PINA).
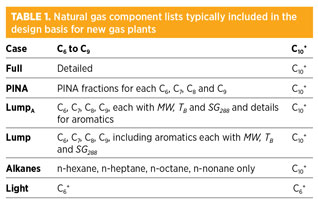 |
In the Lump category, each single-carbon-number group forms a pseudo-component. The heptanes are an example of single-carbon-number groups with a boiling point below and equal to that of n-heptane and above n-hexane. LumpA is similar to Lump, but aromatics are specified separately. Pseudo-components of LumpA and Lump are characterized by specific gravity, SG288; molecular weight, MW; and average boiling point, TB.
In the component list PINA, each PINA fraction is listed for each single-carbon-number group. Physical properties of the fractions are often not provided. In the component list Alkanes, only n-paraffins are listed beyond n-pentane.
The heavy end of a natural gas component list is lumped into one pseudo-component in all of the described lists (e.g., C10+). In the case of Light, even lighter hydrocarbons (i.e., heavier than n-pentane) are included in a C6+ pseudo-component.
The new method is used to exchange the pseudo-components from LumpA and Lump.
Data necessary for solids precipitation. Liquid fugacity and solid vapor pressure are essential physical properties to calculate the solids precipitation of a component in a mixture. They are calculated from the melting point, Tfus, and the heat of fusion, Hfus. Tfus and Hfus can be taken from experiments for individual components. They must also be evaluated for pseudo-components that represent a mixture.
Methods available for lumped pseudo-components. Precipitation must be anticipated to prevent clogged pipes and heat exchanger failure. However, calculating the freezing point without a detailed component analysis is a challenge. In the case of pseudo-components, this requires either specifying Tfus and Hfus, or finding the individual components to represent them.
Previously, two different methods for the first approach were used. Table 2 gives an overview of the benefits and cons of these methods, which is further discussed in the case studies.
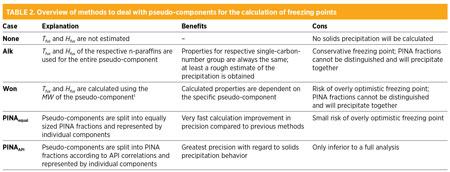 |
Without calculating Tfus and Hfus, precipitation is impeded in the simulations; nevertheless, it is included as method “None” in the overview. Method “Alk” uses Tfus and Hfus from the respective alkanes. Properties supplied in the design basis are not adjusted. In method “Won,” Tfus and Hfus are calculated from the MW of the pseudo-components with correlations, as shown in Eqs. 1 and 2:1
Tfus = 101.35 + 0.02617 MW – 20,172 / MW (1)
Hfus = 0.1426 MW × (273.15 + Tfus) (2)
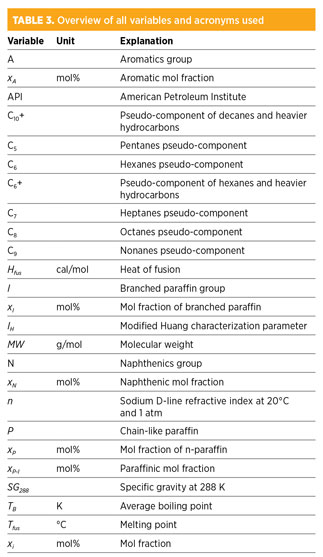
All variables and their units are listed in Table 3.
 |
The heaviest lump fraction sums up all components above a certain boiling point (e.g., C10+) and must be treated separately. The alkane with a boiling point similar to the one in this fraction may be used to represent it and to estimate its solids precipitation.
Splitting lumped pseudo-components. In method “PINAAPI,” individual components are used to represent the pseudo-components (e.g., those from Lump). During the first step in both methods, the fraction is split into an n-paraffinic fraction, xP; a branched paraffinic fraction, xI; a naphthenic fraction, xN; and an aromatic fraction, xA.
The split is performed on the basis of correlations2 based on data from petroleum fractions and coal liquids, as shown in Eqs. 3 and 4:
xP–I = 373.87 – 408.29 SG288 + 1.4772 MW × (n – 1.4750) (3)
xN = –150.27 – 210.152 SG288 – 2.388 MW × (n – 1.4750) (4)
The paraffinic fraction, xP–I, is made up by n-paraffin (xP) and i-paraffins (xI). A typical ratio between both is shown in Eq. 5:
xP = 0.9 xI (5)
N is the naphthenic fraction. The fraction for aromatics is related to the sum of the others, as shown in Eq. 6:
xA = 100 – (xP + xI + xN) (6)
These correlations apply to light petroleum fractions defined by a molecular weight below 200 g/mol. The refractive index, n, is calculated using an API procedure,3 where IH denotes the modified Huang characterization parameter at 20°C, as shown in Eqs. 7 and 8. TB is used in K. Variables and units are specified in Table 3.
 (7)
(7)
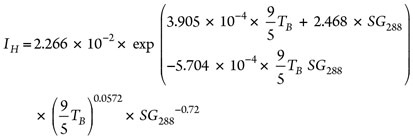 (8)
(8)
There is no aromatic component in the hexanes. Benzene belongs to the heptane fraction because of its high boiling point. In the case of the hexanes, A is set to zero and the sum of P, I and N are renormalized to 100.
In the component list LumpA, aromatics are specified separately. Therefore, a prior calculation step is added, where a new pseudo-component is created from the original one and the respective aromatic. It is only used to estimate P, I and N. A is kept at its original value, and the other three are renormalized. Such an example is discussed in the second case study.
Representing PINA fractions. After LumpA and Lump are split into PINA fractions with the API procedure described above, each is represented with an individual component of the same kind (PINAAPI).
For comparison, pseudo-components are split into equal parts for each PINA fraction and then represented by a discrete component. This is called PINAequal and is discussed in the case studies.
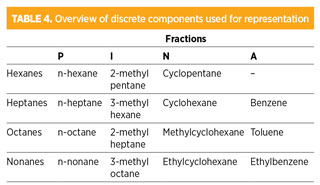
Table 4 gives an overview of the components used for representation. Representation of the PINA fractions of single-carbon-number group fractions can be extended beyond nonanes toward higher boiling points. However, it must be taken into account that the physical properties of the PINA fractions grow more heterogeneous with the higher number of carbon atoms.
 |
Case Study 1. A typical detailed natural gas component list is used as a basis to generate a component list with pseudo-components to demonstrate the quality of the new method.
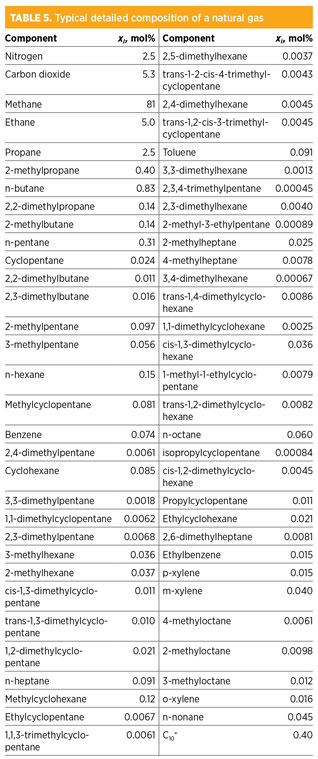
Table 5 shows such a full and detailed component list. It includes the pseudo-component C10+ for heavy hydrocarbons beyond n-nonane, which is not considered for solid precipitation in the following analysis. The Full case is rarely provided in the basis of design and will be compared to different methods dealing with pseudo-components.
 |
A Lump component list is created artificially from Full. This list includes discrete components for each single-carbon-number group. The physical properties MW,SG288 and Tb are calculated for each pseudo-component.
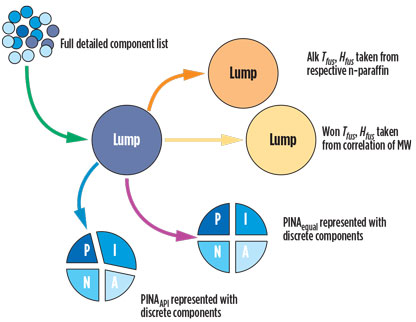
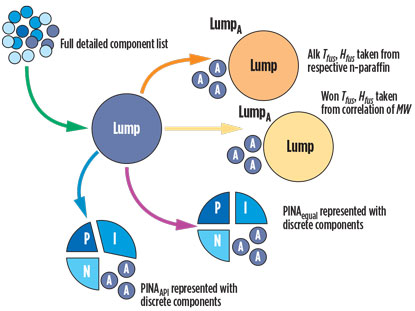
The previous methods, Alk and Won, and the new methods, PINAequal and PINAAPI, are applied to the Lump component list. Fig. 1 shows the approach used in this case study.
 |
|
Fig. 1. Setup of Case Study 1 with the preparation of the Lump component |
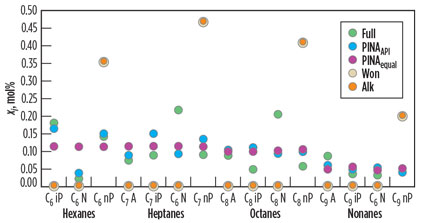
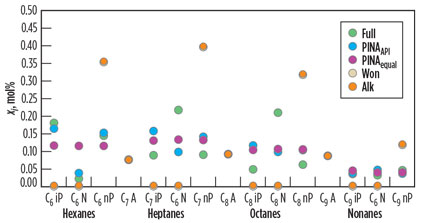
In Fig. 2, the amounts of n-paraffin, i-paraffin, naphthenics and aromatics estimated for the pseudo-components are compared to the amounts in Full. In the case of Alk and Won, there is only a single fraction for each single-carbon-number group. This fraction is included with the n-paraffin fractions.
 |
|
Fig. 2. Comparison of the PINA fractions, xi, of the Full composition with those |
With an equal split, PINAequal, the amounts of the PINA fractions are already close to the fractions in the Full case.
The distribution across the PINA fractions is crucial for solids precipitation. The prediction of PINAAPI has a high accuracy in the case of the hexanes and nonanes, as shown in Fig. 2. In the case of the heptanes and octanes, the amount of naphthenics was estimated too low compared with the Full component list. The naphthenics are the most soluble fraction. With the underestimation of their amount, the calculation remains on the conservative side.
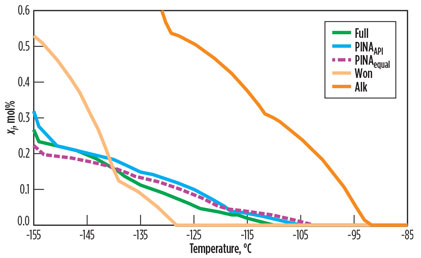
A comparison of the solids precipitation calculation for the Full case and for each of the methods dealing with the Lump component list is depicted in Fig. 3. The freezing point lies at the intersection of each curve, with the temperature axis at xi = 0. The freezing point calculated for Full is at –110°C. Table 6 gives an overview of the freezing points and Δxi/ΔT. The slope of the curve, Δxi/ΔT, gives an understanding of the scaling tendency of the composition with decreasing temperature. The precipitations of the entire composition are added together.
 |
|
Fig. 3. Comparison of four possible methods on the basis of the mol fractions, xi, |
Using Alk leads to conservative predictions, such as a high freezing point at –93°C. There is a risk of overdesign with conservative freezing points. Using the Won method results in –129°C, a low solids precipitation temperature. This result is optimistic, and larger process design margins must be considered.
Both methods retain the pseudo-components in their component list. Although naphthenics and i-paraffins are less likely to precipitate, they add to the precipitation because they are mixed in with paraffins and aromatics in the pseudo-component. This mixture leads to an increased slope of the curve. The curves of Won and Alk do not coincide with the calculations of Full.
PINAequal is close to the full analysis, both in terms of freezing point and in the evolution across temperature. This shows the importance of splitting the pseudo-component. The application of PINAAPI gives even better results.
Fig. 3 shows that the slope of the precipitation curve is close to that of Full, using two methods involving a splitting approach. Table 6 shows a clear difference in the scaling tendencies.
 |
In the case of Won or Alk, the lumped pseudo-components do not distinguish between P, I, N and A. Therefore, the slope of the curve is steep. In the case of PINAequal, PINAequal and Full aromatics and naphthenes precipitate selectively.
Case Study 2. In the second case study, Full (Table 5) is also used as the basis. In LumpA, the pseudo-components used for testing are created from the naphthenics, paraffins and branched paraffins for each single-carbon-number group.
Fig. 4 gives an overview of how the different methods are applied. The aromatics are not included in the lumping, but are kept separately. Aromatics are crucial to solids precipitation and are often provided in the design basis. Therefore, better results are to be expected with LumpA, as can be seen in Table 6. The split fractions are shown in Fig. 5. Note that the amount of aromatics is the same for all five cases.
 |
|
Fig. 4. Setup of Case Study 2 with the preparation of the LumpA component |
 |
|
Fig. 5. Comparison of the PINA fractions, xi, of the full composition with those |
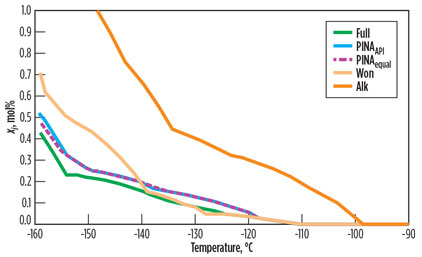
With separate aromatics, Won and Alk have a precipitation curve much closer to Full. Fig. 6 shows that Alk leads to a conservative freezing point and a steep slope of precipitation over temperature. When the aromatics are kept, the Won method gives much better results than in the first case study.
 |
|
Fig. 6. Comparison of four possible methods on the basis of the precipitated mol |
The precipitation slope of Won is very close to that of Full, especially for high temperatures at initial precipitation. This can be explained by the Won method being optimized for single-carbon-number groups rich with n-paraffins, and it proves to be less effective at taking aromatics into consideration, as seen in Case Study 1. In fact, Won, PINAequal and PINAAPI give freezing points very close to that of Full.
Takeaway. A full, detailed component list is rarely provided in the design basis. Previously, the melting point, Tfus, and heat of fusion, Hfus, needed to be estimated for pseudo-components to enable solids precipitation during calculation.
In a new approach, pseudo-components are first split and then represented. The case studies show that using the new method leads to a more realistic representation of the natural gas stream.
Combining a PINA split of lumped pseudo-components and representing the split fractions with individual components comes close to the Full component list with regard to freezing point prediction and precipitation over temperature.
With this innovative approach, additional information can be extracted from lumped hydrocarbon fractions, considerably improving the accuracy of calculating solids precipitation. This method enables the use of less conservative temperature margins in process design. GP
Literature cited
1Won, K. W., “Thermodynamics for solid solution-liquid-vapor equilibria: Wax phase formation from heavy hydrocarbon mixtures,” Fluid Phase Equilibria, Issue 30, Vol. 25, pp. 265–279, 1986.
2Riazi, M. R. and T. E. Daubert, “Prediction of molecular-type analysis of petroleum fractions and coal liquids,” Ind. Eng. Chem. Process. Des. Dev., Vol. 25, pp. 1009–1015, 1986.
3Riazi, M. R., T. E. Daubert and R. P. Danner, “API databook procedure 2B5.1,” API Technical Data Book, American Petroleum Institute, Washington DC, 1983.
 |
Iljana Miethe is a physical property expert in the IT department for process design and control at Linde’s engineering division. Her role involves implementing new physical property calculation methods, supporting process design engineers with physical property needs and training Linde engineers in thermodynamics. Her technical focus is on natural gas treating and liquefaction, especially with respect to solids formation. She holds a degree in chemistry from Freie Universität in Berlin, Germany, and a PhD in applied physical theoretical chemistry from Technische Universität München in Germany.
 |
Gerhard Lauermann is a senior physical property expert in the IT department for process design and control at Linde’s engineering division. He has over 30 years of experience in thermodynamics and physical properties for process design, process simulation and online optimization. He is a joint inventor to several patents in chemical engineering and the coauthor of a number of publications in scientific journals and in Ullmann’s Encyclopedia of Industrial Chemistry. He is a member of the Section F Research Committee of the Gas Processors Association, and is also a member of the ProcessNet Technical Committee on Thermodynamics. He earned a degree in chemistry and a PhD in physical chemistry, both from Universität Regensburg in Bavaria, Germany.
 |
Bernd Jungfer is a senior process design engineer in the department for process design of natural gas plants at Linde’s engineering division. He has more than 18 years of experience in process and equipment design for LNG plants, with a special focus on cryogenic heat exchangers. He earned a degree in chemical engineering from Technische Universität München in Germany.


Comments