Understanding RAM analysis and typical availability values for LNG plants
F. J. Malaret, Technip, Paris, France
The overall production availability of an LNG plant is a major criterion for economic evaluation. It is, therefore, important to have an estimation of the overall availability of an LNG plant, especially at the early stage of development.
A simple way to perform this estimation that does not require any calculations is to use availability data from a reference project, or to use typical mean production availability (PA) values for LNG projects. To perform meaningful comparisons, the reliability, availability and maintainability (RAM) model and the reliability data used must be fully understood.
PA for an LNG plant is discussed, encompassing the major considerations of RAM analyses in LNG plants. Typical availability values are given to perform economic evaluations during the early phase of a project (i.e., conceptual or feasibility studies) when detailed information to perform rigorous calculations is not available.
Estimating production efficiency. The overall production efficiency of an LNG project encompasses all of the steps in the LNG production chain (Fig. 1). These steps include upstream units (i.e., offshore platform, pipelines and subsea system), the LNG plant itself, the storage and loading system, the LNG carrier fleet, and sometimes the regasification terminal that will receive the LNG.
|
Fig. 1. LNG chain flow diagram. |
The production loss due to LNG storage and loading facilities is addressed on a high-level basis. The availability of LNG storage is generally proportional to the size of the export fleet. Detailed studies can be performed to determine the optimum fleet size required to distribute free-on-board (FOB) LNG product to customers. These studies can also help optimize the LNG tank storage capacity to minimize production losses due to “tank tops,” which occur when tanks are full and no storage is available for additional LNG production. These studies must take into account the reliability of the loading arms, the access to the loading berth(s) and the influence of inclement weather.
The estimated availability of an LNG plant can impact profit loss and dictate the size and scope of the distribution fleet, the upstream facilities and the LNG regasification terminal(s) served.
Calculating production availability. Generally speaking, the availability is the probability of an item (in this case, an LNG plant) to be in a state to perform a required function at a given point of time or over a given time interval. PA is often used when describing the production efficiency of a system,2 as this metric can be easily used for economic evaluations.
Here, the PA is defined as the percentage of the predicted achievable production (PAP) over the potential production (PP), as shown in Eq. 1:
![]() (1)
(1)
The PAP is the total production over the field life as predicted by a model (for example, a RAM analysis), taking into account the production losses due to scheduled downtime required for maintenance and inspections, and unscheduled downtime as a result of the random failure of components or equipment.
Unscheduled events are random in nature. Downtime due to equipment failures takes into account all repair and logistics time (i.e., active repair time; mobilization delays; diagnosis of the problem; unavailability of spare parts; production losses due to startup, restart and ramp-up to full production, etc.).
Reliability data1, 5 for unscheduled events is based on statistical data collected on the availability of similar pieces of equipment. For pieces of equipment dedicated to the LNG industry, such as cryogenic heat exchangers, LNG turboexpanders, gas turbines used as mechanical drivers for refrigeration compressors and other equipment, reliability data is generally taken directly from vendors.
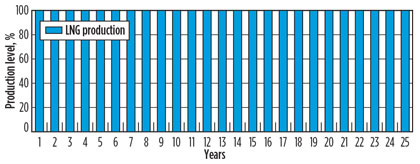
PP2, 3 (Fig. 2) is the production over the field life as determined by the deliverability profile for the system—i.e., the maximum LNG production, assuming that the LNG plant will run continuously, without any interruption. For chemical engineers, this profile corresponds to the value indicated on heat and material balances.
 |
|
Fig. 2. Potential LNG production. |
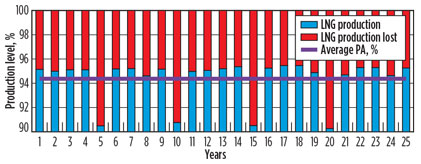
Fig. 3 shows a hypothetical LNG production profile over the life of an LNG plant. Some production loss is seen during the operating years due to unscheduled events, which typically vary only slightly in years without planned maintenance.
 |
|
Fig. 3. Annual trend in LNG PA over the project life. |
It can also be seen that LNG production is reduced in years where planned maintenance and/or inspections take place, since a total LNG plant shutdown is required. The predicted average LNG PA of the facility is shown as a purple line. Note: The PA shown in the chart is a through-life average, where the actual value will vary from year to year.
For example, if the maximum LNG production of a facility is 3 MMtpy and the predicted average annual production from a RAM model is 2.7 MMtpy, then the average PA would be 90%. In other words, on average, 90% of the time the LNG plant will produce at its maximum capacity of 3 MMtpy, and 10% of the time it will not produce LNG due to scheduled and unscheduled events. This figure can also be interpreted on a 365-day basis as an average of 328.5 days producing at maximum capacity and 36.5 days of no production.
From this point on, the term “availability” will be used to refer to the yearly mean production average throughout the life of the project.
Understanding RAM analysis of LNG plants. RAM analysis predicts production losses for estimating the real throughput of an LNG plant. RAM techniques can be applied at any stage of a project, from engineering design to the operational stage.
The principal objectives of a RAM study are to:
- Quantify the expected PA for the LNG, based on the configuration of the LNG plant and reliability data
- Evaluate the PA of other products, such as LPG, ethane, propane, butane or condensates
- Provide a detailed analysis of the LNG production loss (by system or equipment) to identify the key contributors
- Quantify the impact on production of various changes to the system configuration, operating philosophy and maintenance strategy, as well as the impact on the achieved system performance, through sensitivity analysis and availability improvement measures
- Provide recommendations on how to improve the PA of the facilities.
Battery limits for RAM studies in LNG plants. In general, the battery limits extend from the isolation valves upstream of the turret (for FLNG facilities) or upstream of the inlet facilities (for onshore plants), up to the isolation valves upstream of the LNG storage tanks. However, RAM analysis sometimes includes the LNG storage, offloading facilities and shipping operations.
The scope of RAM studies for LNG plants generally excludes the following:
- Early life and wear-out period
- Upstream system (offshore platform, pipelines, subsea system, etc.)
- Shipping (LNG carrier) operations
- Utility systems that are noncritical to operations
- LNG storage and offloading facilities
- Meteo-marine conditions impacting mooring, offloading and departure of LNG carriers
- Extreme climatic conditions impacting production
- Support hull operations with no impact on production (only applicable for FLNG)
- Meteo-marine conditions impacting LNG production/hull motion (only applicable for FLNG)
- Catastrophic events.
As catastrophic events are very rare, the expected contribution from such events is not representative and is normally a small quantity. These events are not normally included in RAM analyses, but rather addressed in risk analyses. If the catastrophic event occurs, the actual loss would be large, which could mean a dramatic reduction in PA.
According to the International Organization for Standardization’s ISO 20815, “Some serious, infrequent events will cause long-term shutdown of production.”4 These so-called catastrophic events include:
- Earthquakes
- Fires and explosions
- Blowouts
- Sabotage
- Structural collapse
- Major problem with casing or wellheads
- Riser or export pipeline ruptures
- Falling loads with large damage potential
- Other events, or combinations of events, with large damage potential.
Typical availability values of LNG plants. Availability information from several LNG projects has been collected and analyzed to generate statistical data. The projects selected are considered to be a good representative sample for LNG plants, as they cover a wide range of situations:
- Environmental conditions: from mild climates to extreme conditions, such as the Arctic
- Onshore and offshore projects (with different sea motions)
- Process schemes, capacities, flaring management, technologies, drivers, sparing philosophies, etc.
- Different availability and reliability data
- Various maintenance requirements and strategies
- Country regulations, and company safety rules and specifications
- Crew availability, spare parts management, etc.
The results in this section are expressed with one-decimal figures. The intent is to show the tendency, rather than an exact value. Mean values are reported with ± and their standard deviation.
So, what is the typical PA for an LNG plant? The typical LNG plant PA, including both scheduled and unscheduled events, ranges from 89.4%–95.5%, with a mean value of 92.6% ± 2.2%.
Another important question is: What is the typical average production loss due to scheduled events in an LNG plant? The production loss can be accurately evaluated if the following items are known:
- Interval for maintenance and inspections
- Duration of each total shutdown
- Amounts of time needed to stop and to ramp up production.
Typically, the unavailability of LNG plants is driven by the maintenance pattern of the drivers used for the refrigeration-cycle compressors, but other factors must be taken into account. The information needed to perform detailed calculations may not be available during the conceptual phase, so an average value for losses of 2% can be considered.
The exact values calculated for the typical production losses due to scheduled maintenance ranges from 1.4%–3%, with a mean value of 2.1% ± 0.6%.
Production loss corresponds to unavailability. Eq. 2 can be used to calculate the associated availability:
Availability = 100% – Unavailability (2)
Note: The downtime due to scheduled events could be reduced by optimizing maintenance patterns.
A third essential question is: What is the typical average production loss due to unscheduled events in an LNG plant? The production loss due to unscheduled events is a consequence of the random failure of equipment. Reliability block diagrams (RBDs) and failure modes and effect analyses (FMEAs) must be performed to accurately predict the production loss. Nonetheless, the information needed to perform such detailed calculations for each process unit may not be available during the conceptual phase.
The calculated value for yearly average production losses due to unscheduled events ranges from 2.5%–9.5%, with a mean value of 5.2% ± 2.6%.
Takeaway. When comparing the PA value for different LNG projects, it is important to understand the basis of each study, as the results will be significantly impacted by differences in the battery limits, exclusions, reliability data set and other factors.
Due to the random and statistical nature of the data used to estimate the PA, the results obtained from a RAM analysis for a given project can vary significantly if other bases for the study are considered. Each LNG project is unique, and it is difficult to compare one to another from a reliability point of view. The values provided here are not intended to substitute for detailed RAM studies to predict the actual output of an LNG plant. Rather, they are intended to offer an understanding of the order of magnitude of the loss of LNG production due to planned and unplanned events.
 |
 |
|
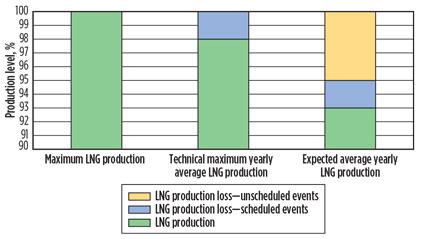
Fig. 4. Typical LNG production loss in LNG plants. |
Table 1 gives a summary of the typical PA values for LNG plants obtained from RAM studies performed at the FEED stage, and Fig. 4 shows typical LNG production loss in LNG plants. The average PA can be used to estimate the design capacity of an LNG plant, as shown in Eq. 3:
![]() (3)
(3)
Average PA can be adjusted depending on the context of a new LNG plant. For example, for a project that will be constructed in a place with extreme climatic conditions, the availability of the LNG plant will be lower than average; therefore, the average PA can be corrected before evaluating the design capacity. GP
Note
Any opinions, findings and conclusions or recommendations expressed in this material are those of the author and do not necessarily reflect the views of Technip.
Acknowledgments
The author thanks Nathalie Millot and Vincent Tirilly, of the process and technology division of the LNG department at Technip, for their technical assistance.
Literature cited
1Collins, S., et al., “Improving LNG importation reliability,” proceedings of LNG XI, Birmingham, UK, 1995.
2Mokhatab, S., “Plant reliability and availability,” Hydrocarbon Processing, December 2007.
3International Organization for Standardization, NF EN ISO 14224, “Petroleum, petrochemical and natural gas industries: Collection and exchange of reliability and maintenance data for equipment,” June 1, 2012.
4International Organization for Standardization, NF EN ISO 20815, “Petroleum, petrochemical and natural gas industries: Production assurance and reliability management,” June 1, 2010.
5DNV, OREDA, Offshore Reliability Data Handbook, 5th Ed., 2009.
 |
Francisco Malaret is a senior process engineer with more than eight years of experience in the oil and gas industry, specifically in onshore and offshore LNG projects. His experience covers conceptual to detailed studies, including basic engineering; front-end engineering design; and engineering, procurement and construction. Mr. Malaret earned a BScEng degree in chemical engineering and a BSc degree in chemistry, graduating cum laude from Universidad Simon Bolivar in Venezuela. He also holds an MS degree in oil refining from the IFP School in France.


Comments