
Troubleshoot and solve a gas treater downcomer unsealing problem: Part 2
H. Z. Kister, Fluor, Aliso Viejo, California; and N. M. Mohamed, WorleyParsons Engineering Pty Ltd., Abu Dhabi, UAE
The ADGAS Integrated Gas Development (IGD) fuel gas treatment (FGT) system is a methyldiethanolamine (MDEA) absorber-regenerator system designed to supply 25 MMscfd of sweet fuel gas (having less than 20 ppm of H2S) for the IGD turbines and the flare purge and pilots. The FGT system was designed by an engineering contractor from Japan, and the tower internals were provided by a major tray supplier.
At plant rates above 10 MMscfd–12 MMscfd, the absorber column, which contained moving valve trays, became very unstable and flooded, resulting in a sudden liquid carryover that led to tripping the whole system. Changes to the MDEA flowrates did not appear to have much influence. Any attempt to raise the gas load above 10 MMscfd–12 MMscfd and keep stable column operation failed. An attempt to fix the problem by the contractor and vendor failed to provide a significant improvement.
A thorough troubleshooting investigation by ADGAS, together with a hydraulic analysis by Fluor, yielded a correct diagnosis and a successful solution. Part 11 focused on the troubleshooting process. Troubleshooting efforts combined measurements, inspections and targeted tests to invalidate the key theories of fouling, damage, installation error, foaming and high liquid level at the tower base.
With all of these theories denied, there was no explanation for the premature flood. ADGAS has another absorber in similar service that contains bubble cap trays and was working properly. In the absence of a definition of the root cause, ADGAS decided to scale up the design of the working absorber as a second fix for the problematic absorber. The proposed changes are described in Part 1.
To avoid another failure, ADGAS requested Fluor to review the design of the second fix and evaluate whether it would solve the problem. Fluor’s approach was to work with ADGAS to identify the root cause before evaluating the solution. The joint investigation that led to the root cause is described here.
A review of the ADGAS test data, together with the observation of a low head loss at the downcomer exit (see Table 2 in Part 1), prompted exploration of a downcomer unsealing problem, which, until then, was not on the troubleshooting checklist.
Focus on downcomer sealing. The challenges of handling low liquid loads in tray towers are maintaining a minimum liquid volume level on the tray, and keeping the downcomers liquid-sealed.2 When a downcomer loses its liquid seal, gas rises up through it and interferes with liquid descent. This interference has led to capacity bottlenecks, poor separation, instability and total inability to start up towers.
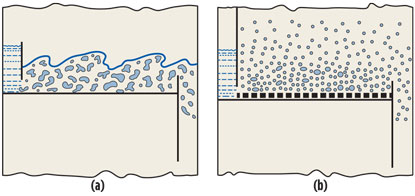
On conventional trays, at liquid flowrates above 20 m3/hr–30 m3/hr per m of outlet weir, the outlet weir generates a frothy pool (Fig. 1a).4 As long as the downcomer clearance is lower than the liquid head in the pool, this liquid pool will seal the downcomer.
 |
|
Fig. 1. Flow patterns on trays froth regime (a) and spray regime (b). The liquid |
In contrast, at low liquid flowrates (i.e., below 20 m3/hr–30 m3/hr per m of outlet weir), and especially at high gas velocities, the gas atomizes the tray liquid, forming a dispersion known as the spray regime,3, 5 or drop regime. In this regime, there is no frothy pool, and the liquid resides as atomized drops in the inter-tray space (Fig. 1b). The continuous gas phase reaches the downcomer outlet. There is no static seal to prevent gas from rising up into the downcomer. In the spray regime, the downcomers are prone to seal loss.
Fig. 2 illustrates how downcomer unsealing can bottleneck a tower in the spray regime. This is a common scenario at startups at low liquid rates. Consider a tray with very little liquid on it. The gas, looking for the easiest path, ascends through both the trays and downcomers (Fig. 2a). Upon liquid introduction, some liquid flows across the tray and reaches the downcomer (Fig. 2b). If the gas velocity through the downcomer is too high, it will not allow the liquid to descend into the downcomer (Fig. 2c). Unable to descend, the liquid will accumulate on the tray above. The tray will flood, and liquid will carry over to the top of the tower (Fig. 2d).
 |
|
Fig. 2. How downcomer unsealing bottlenecks a tower in the spray |
Downcomer unsealing in the spray regime was modeled by Kister,7 with slightly revised equations published later.8 Successful applications of this model were reported.9, 10 No other downcomer sealing models are found in the literature. Previous applications of the Kister model were done for sieve trays. Extension of the model to valve trays requires special consideration, as will be discussed.
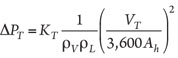
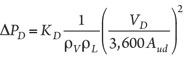
Downcomer sealing in valve trays. In sieve and bubble-cap trays, the dry pressure drop (i.e., the pressure drop through the tray perforations) increases with the square of the gas velocity. For a tray with very little liquid on it, raising the gas rate will increase the hydraulic resistance to the ascending gas through both the tray perforations and the downcomer clearance (Fig. 2a), according to Eqs. 1 and 2:
 (1)
(1)
and
 (2)
(2)
where:
∆P=Dry pressure drop, mm liquid
V=Vapor (gas) flowrate, kg/h
K=Orifice constant, mm liquid (s/m2)2
A=Area, m2
ρ=Density, kg/m3
L=Liquid flowrate, m3/h
T=Tray
D=Downcomer
h=Tray holes
ud=Clearance under the downcomer.
Since the gas splits between the tray and downcomer in a way that minimizes hydraulic resistance, the pressure drops in Eqs. 1 and 2 are equal, giving Eqs. 3–5:
![]() (3)
(3)
and
![]() (4)
(4)
where:
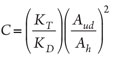 (5)
(5)
Eqs. 3–5 state that the split of gas between the tray holes and the downcomer depends only on the open areas and the orifice coefficients, but not on the gas flowrate. Eq. 3 also states that, as the gas flowrate to the tower decreases, so does the gas flowrate through the downcomer.
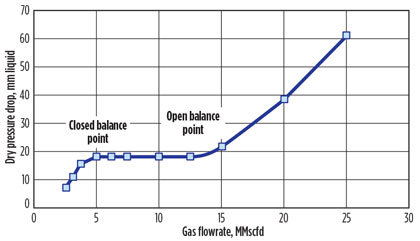
In valve trays (Fig. 3), the valves are closed at low gas flowrates. Eqs. 1–5 apply, with Eq. 1 based on the area of the cracks under the valve floats left open when the valves are fully seated. Above a certain gas rate (i.e., “the closed balance point”), the valves begin to open, at which point the pressure drop becomes constant and no longer rises until all of the valves open (i.e., “the open balance point”).
 |
|
Fig. 3. As valves open or close, dry pressure drop stays constant. |
At gas flowrates above the open balance point, the dry pressure drop again rises with the gas rate according to Eq. 1. This time, the hole area is the full open slot area. Between the closed and open balance points, Eq. 1 does not apply. The pressure drop is given in Eq. 6:
ΔPT = Ko(6)
where Ko is a constant.
For the trays in Fig. 3, the constant value is approximately 18 mm of liquid. Combining Eqs. 2 and 6 means that, while the valves are opening, the pressure drop across the downcomer remains constant, and so does the gas flowrate through the downcomer. The gas flowrate through the downcomer is given in Eq. 7:
 (7)
(7)
With the sieve, bubble-cap and valve trays above the open balance point, lowering the total gas flowrate reduces the gas flowrate through the downcomer, giving liquid a chance to descend and seal the downcomer (and avoiding the steps in
Fig. 2c and Fig. 2d). The same does not occur with valve trays operating in the flat region of Fig. 3. In this region, the reduction in the total gas flowrate no longer reduces the gas flowrate through the downcomer, until all valves close and the tray pressure drop again starts to decline.
The preceding model is only valid in the spray regime (shown in Fig. 1b); i.e., when the liquid flowrate is 20 m3/hr–30 m3/hr per m of outlet weir or less. At higher liquid loads, there is a transition to the froth regime. In the fully developed froth regime, the outlet weir generates a frothy pool (Fig. 1a) on the tray that keeps the downcomer liquid-sealed. During the transition, the frothy pool begins to form and cuts the effective downcomer escape area, Aud. The gas flow up the downcomer is reduced, which helps seal the downcomer. The model does not account for this effect, and it should not be applied for liquid loads above 20 m3/hr–30 m3/hr per m of outlet weir.
Downcomer unsealing in the FGT absorber. The actual pressure drop characteristic for the trays in the FGT absorber is shown in Fig. 3. For gas flowrates between 5 MMscfd and
13 MMscfd, the valve trays operate in the flat region of Fig. 3.
Downcomer unsealing flood occurs when the gas velocity inside the downcomer is too high to permit all of the liquid to descend. That gas velocity can be estimated by hydraulically modeling the unsealed downcomer as a counterflow column, through which gas ascends and liquid descends simultaneously, both fighting for the same opening.
The counterflow column used in the authors’ past modeling work was a wetted-wall column.7 Considering the sloped downcomer and the availability of the newly developed baffle tray flood correlation,11 the authors preferred to model the downcomer as a baffle tray, with gas and liquid competing for the narrow opening at the bottom of the tapered downcomer. Calculations were checked by comparing them to the system limit correlation,12 and the authors found that the gas velocities calculated from the baffle tray model were approximately 15% less than those from the system limit correlation.
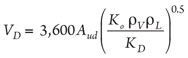
Figs. 4–6 display the calculation results. Fig. 4 shows that, at the design liquid load of 38.5 m3/hr, the gas velocity through the downcomers is too high to permit liquid descent when the gas flowrate exceeds 6 MMscfd. Above 8 MMscfd, the gas flowrate through the downcomers is about 137% of the flood. This figure is not accurate, and is likely to be high, because the design liquid load of Fig. 4, 34 m3/hr per m of outlet weir, is just outside the range of the model.
 |
|
Fig. 4. At the operating liquid load of 20 m3/h, the gas velocity through the |
As stated earlier, the authors’ model is valid when the liquid flowrate is 20 m3/hr–30 m3/hr per m of outlet weir or less. While the 137% of flood is not an accurate value, the gas rate is still expected to exceed that of a downcomer seal flood.
The middle curve in Fig. 4 shows that the percent of downcomer seal flood declines to 102%—still above the flood point—when the liquid rate is lowered to 20 m3/hr. This liquid rate is well within the range of the authors’ model. At 20 m3/hr, the flood point is above 10 MMscfd. The lower curve on Fig. 4 shows that, at a liquid rate of 10 m3/hr, the percent flood at the downcomer is well below 100%, so that flooding would not be experienced. However, this liquid load was too low to permit good absorption and was only used at very low gas rates (see Table 3 in Part 1).
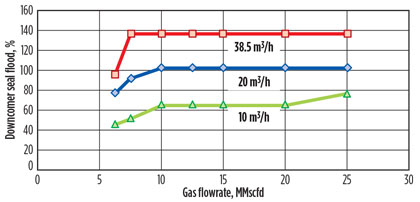
Fig. 5, based on a 20-m3/h liquid rate, shows how the valve tray design could have been modified to circumvent the downcomer unsealing flood. The upper curve is for the original valve tray design with a 50-mm clearance and sloped downcomers, and is the same as the middle curve in Fig. 4.
 |
|
Fig. 5. The valve tray design could have been modified to circumvent the |
The lower curve in Fig. 5 shows that a smaller clearance would have reduced the gas flow up the downcomer to well below the flood point at all gas loads, allowing liquid to descend with no difficulty and seal the downcomers. The tower would have worked, and there would have been no need for troubleshooting. The large impact of downcomer clearance on downcomer sealing was previously reported in sieve trays.7
The middle curve in Fig. 5 shows the effect of using straight instead of sloped downcomers in the original valve trays. The tray active areas were kept the same as in the original design (0.63 m2, as in Fig. 2 in Part 1), making the downcomer 328 mm wide. The downcomer clearance was kept at 50 mm, per the original design. Compared to the original design (Fig. 1 in Part 1), the straight downcomer was narrower at the top but wider at the bottom.
The middle curve in Fig. 5 also shows that the larger area near the bottom of the downcomer would have reduced the gas velocity through the downcomer to well below the flood point at all gas loads, allowing liquid to descend and seal the downcomers. Had the downcomers been straight at 328 mm wide, the tower would have worked well even with the 50-mm clearances, and there would have been no need for troubleshooting.
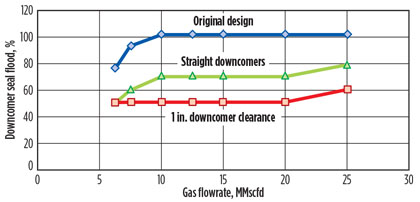
Fig. 6 compares the downcomer seal flood curves, at a 20-m3/h liquid rate, for the bubble-cap trays of the second fix (lower curve) and for the original valve trays (upper curve, same as the middle curve in Fig. 4). It is important to appreciate that the bubble-cap tray design in the second fix had smaller downcomer clearances, larger active areas, and larger fractional hole areas than the original valve tray design, all of which will divert more gas through the trays and less through the downcomers, thereby reducing the percent downcomer seal flood.
 |
|
Fig. 6. Comparison of the downcomer seal flood curve for the bubble-cap trays |
Fig. 6 also shows that the downcomers for the new bubble-cap trays would operate well below the downcomer seal flood rates at all gas rates. Liquid will be able to descend with no difficulty and form a seal at the bottom of the downcomer that would prevent further gas rise. Based on this finding, Fluor gave a full endorsement for the second-fix design.
The success of bubble-cap trays for solving downcomer sealing problems at low liquid rates is not unique to this tower. Previous reports13 show successful sealing experiences with bubble-cap trays at the extremely low liquid rates used in gas plant glycol dehydrators.
Besides avoiding the constant dry pressure drop region of the valve trays (Fig. 3), which tends to divert a high gas flow through the downcomers, the use of bubble caps allows the incorporation of more open area on the trays, without fear of leaking the small amount of liquid that is held on the trays at these low liquid rates. A well-designed and well-sealed bubble-cap tray is highly leak resistant because the gas enters approximately 70 mm above the tray floor.
Takeaway. The valve trays in the tower were replaced in October 2013 by the new bubble-cap trays described in the second fix. The tower has been performing well ever since that time, with no signs of flooding or instability, even when operating well above the design rates.
Extensive tests after the second fix showed minimal pressure drop fluctuations with increases in the feed gas flow to the FGT absorber. Pressure drop did not exceed 7.5 mbar/tray, even at a gas flow of 25 MMscfd and an MDEA flow of 40 m3/hr. There were no issues with the FGT absorber operation and its bubble-cap trays when feed gas was quickly ramped up. No sudden pressure drop increases were recorded, and the tower did not take long to stabilize at the new gas flowrates. The H2S content of the overhead gas ranged from 0 ppmv–2 ppmv—well below the 20-ppmv maximum.
This case study sheds light on the unique experience of downcomer seal loss in moving valve trays. The constant dry pressure drop held by the valve tray as valves close off at reduced rates (shown in the flat portion of the curve in Fig. 3) can make downcomer sealing difficult in moving valve trays, especially with large clearances. Large downcomer clearances should be avoided at low liquid rates, both with valve trays (as in this study) and in other trays.7
Finally, this study emphasizes the effectiveness of bubble-cap trays to deal with downcomer unsealing problems, as noted in literature.13
End of series. Part 1, January/February 2015. GP
Note
This article will be presented at the Distillation Topical Conference of the AIChE Spring Meeting in Austin, Texas in April.
Literature cited
1Kister, H. Z., and N. M. Mohmed, “Troubleshoot and solve a gastreater downcomer unsealing problem: Part 1,” Gas Processing, January/February 2015.
2Kister, H. Z., “What caused tower malfunctions in the last 50 years?” Trans. IChemE, Vol. 81, Part A, January 2003.
3Lockett, M. J., Distillation Tray Fundamentals, Cambridge University Press, Cambridge, UK, 1986.
4Reprinted with permission from Kister, H. Z., “Design and layout for sieve and valve trays,” Chem. Eng., September 8, 1980, illustration copyright by McGraw-Hill Inc., New York, New York.
5Kister, H. Z., Distillation Design, McGraw-Hill Inc., New York, New York, 1992.
6Reprinted with permission from H. Z. Kister, Practical Distillation Technology, course manual, 2013.
7Kister, H. Z., “When tower startup has problems,” Hydrocarbon Processing, February 1979.
8Kister, H. Z., Distillation Operation, McGraw-Hill Inc., New York, New York, 1990.
9Kister, H. Z. and M. Olsson, “Understanding maldistribution in 3-pass trays,” Chem. Eng. Res. and Dev., Vol. 89, Elsevier BV, Amsterdam, The Netherlands, August 2011.
10Bernard, A. “Distillation: Avoid problems during tower startup,” Chem. Eng., June 1, 2012.
11Kister, H. Z. and M. Olsson, “Don’t let baffle tray flood baffle you,” Chem. Eng. Progr., July 2011.
12Stupin, W. J. and H. Z. Kister, “System limit: The ultimate capacity of fractionators,” Trans. IChemE, Vol. 82, Part A, January 2003.
13Lieberman, N. P., “Troubleshooting natural gas processing,” PennWell Books, Tulsa, Oklahoma, 1987.
 |
Henry Z. Kister is a Fluor Corp. senior fellow and director of fractionation technology. He has over 30 years of experience in design, troubleshooting, revamping, field consulting, control and startup of fractionation processes. He is the author of three books, the distillation equipment chapter in Perry’s Chemical Engineers’ Handbook, and approximately 100 articles. He has taught the IChemE-sponsored “Practical Distillation Technology” course over 450 times in 25 countries. A recipient of several awards, Mr. Kister obtained his BE and ME degrees from the University of New South Wales in Australia. He is a fellow of IChemE and AIChE, and a member of the NAE.
 |
Nashaat M. Mohamed is a senior engineer for WorleyParsons Engineering–Abu Dhabi, and has served as the project management consultant for ADGAS’ Offshore Associated Gas and Integrated Gas Development projects since 2008. Mr. Mohamed joined Suez Oil Processing Co. in 1971 as a process engineer. He then worked for ARAMCO from 1979, and also for ADGAS between 1981 and 2008, when he retired as process team leader. He holds a BSc degree in chemical engineering from Cairo University in Egypt.


Comments