Optimize compressor parameters for reduced inlet pressure and gas flow
L. K. Singh, Consultant, Kuala Lumpur, Malaysia
Produced gas pressure at the wellhead normally is not sufficient to allow export for sales and further treatment. Therefore, an export gas compression system is required, with a centrifugal compressor being the most suitable for variable sales gas demand and near-constant export pressure.
Normally, the export gas centrifugal compressor works well under constant inlet pressure. Compressor operation is challenged when the gas well reservoir pressure is reduced (due to reservoir depletion), and when the full well steam (FWS) water cut increases and the gas fraction in the FWS decreases. Consequently, inlet pressure to the compressor is reduced.
The compressor operation becomes unstable due to reduced inlet pressure and reduced flow. To meet the required export gas pressure, the speed of the compressor must be increased. However, the temperature of the compressor discharge also increases at reduced flow and higher speed; therefore, the recycle is also required to maintain the compressor discharge temperature within a defined limit.
A step-by-step approach is discussed1 to check compressor performance by ascertaining the minimum possible suction pressure at various fixed flows. A compressor operating map is provided for selection of the compressor speed, operational stage(s), and recirculation parameters. Compression operating conditions can be successfully selected by reading the compressor operating curve, which is based on compressor inlet pressure and gas flow.
Modern simulation software is useful for providing quick, reliable and cost-effective solutions to problems related to steady state and dynamic study. However, there is always some level of uncertainty and inaccuracy due to the use of simplifications, assumptions and numerical calculations. Therefore, model developers must adjust, refine, and validate their models with actual plant data to simulate more accurately the real process and events.
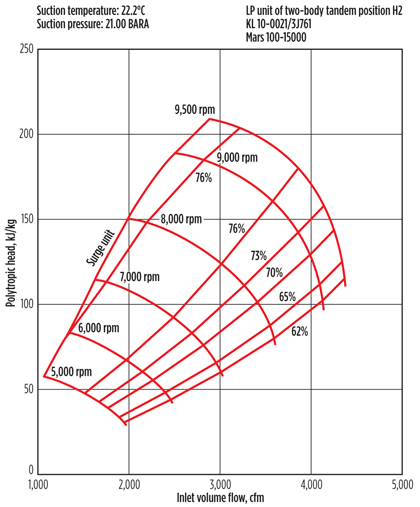
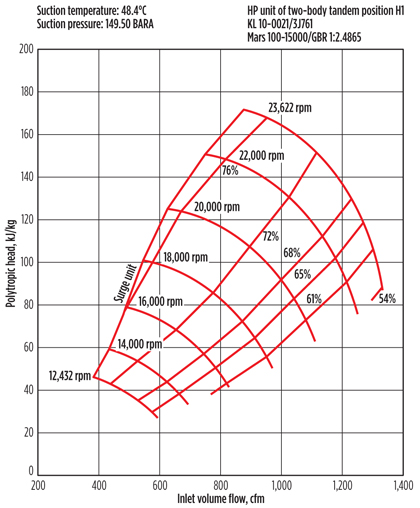
The compressor performance curves of a two-stage export gas centrifugal compressor, operated at variable speeds, are shown in the head-flow characteristic in Fig. 1 (low-pressure, or LP, stage) and Fig. 2 (high-pressure, or HP, stage). The gear ratio between the first (LP) stage and the second (HP) stage is 2.48.
 |
|
Fig. 1. First-stage LP compressor performance curve. |
 |
|
Fig. 2. Second-stage HP compressor performance curve. |
The operating range of the first-stage compressor is limited by maximum (9,500 rpm) and minimum (5,000 rpm) operating speeds, maximum available power, choke flow and stability (surge) limits. At flows lower than the stability point, the compressor initially shows a reduced capacity to generate head with reduced flow, until it experiences reverse flow—i.e., when the gas flows from the discharge side to the suction side.
Study outline
The parameters and key assumptions for the compressor study are outlined below.
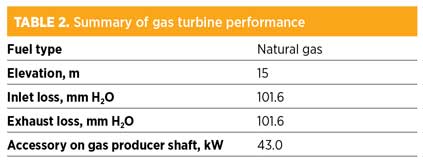
Basis and assumptions. Specifications presented in Table 1 are for a two-stage, gas turbine-driven, single-shaft centrifugal compressor. Ambient reference conditions corresponding to ISO standards are:
- Ambient pressure: 1.013 bar
- Ambient temperature: 15°C
- Relative humidity: 60%
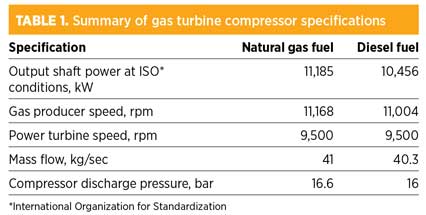
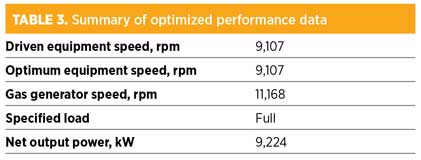
Gas turbine performance curves (ISO) provide nominal performance data for the gas turbine at site conditions (Tables 2 and 3). The following curves are provided:
- Output power and heat rate vs. engine inlet temperature
- Output power and heat rate vs. power turbine speed (two-shaft engine only).
Gas compressor performance curves provide information about the predicted compressor performance. The following curves are provided:
- Polytropic head vs. actual flow, with speed and polytropic efficiency as parameters
- Discharge or suction pressure vs. standard flow, with speed, efficiency and power
- Pressure ratio vs. standard flow, divided by suction or discharge pressure.
Other compressor design constraints include:
- First-stage compressor, C51 limit notes:
- Dry gas seal temperature limit: 250°F (121°C)
- Second-stage compressor, C16 limit notes:
- Dry gas seal temperature limit: 275°F (135°C)
- Maximum compressor discharge temperature: 175°C
- Minimum seal gas pressure: 100 psi (7 bar) above suction pressure
- Specified outlet temperature: 50°C
- Side stream outflow: 2.5 MMscfd
- Gearbox inputs:
- Gear ratio: 1 to 2.48
- Gearbox power loss: 111.9 kW.
The first-stage export gas compressor had an after-cooler duty of 3,465 kW, while the second-stage export gas compressor had an after-cooler duty of 5,049 kW.
Objective. The objective of this study was to optimize the compressor controlling parameters to lower the compressor inlet pressure at various gas flows, while still keeping the discharge pressure of the second stage of the compressor (i.e., the required export gas pressure) almost constant; and also to develop the compressor operating map.
Simulation methodology. The process by which the compressor controlling parameters were optimized contains several steps:
- Develop the compressor simulation model process flow diagram, and then define the inlet stream to the compressor.
- Input the compressor performance curves and surge line curves.
- Before defining the curve, select the single-molecular-weight curve, since the molecular weight of gas is assumed to be constant.
- Select the polytropic efficiency before entering the compressor operating speed. Add the curve (at a different speed than the value obtained from the curve for flow (actual air compressor capacity) and head (i.e., convert polytropic head to meter).
- Take a 12%–15% margin from the actual surge limit to the operating surge line, and add the surge line curve.
- Enter the speed of the compressor based on the vendor curve data and operating point. The maximum speed of this compressor is 9,500 rpm on a rated flow of 165 MMscfd, which is also the limit for the prime-mover maximum-rated speed; therefore, the speed of the compressor is given within this limit.
- Similarly, define the second-stage export gas compressor.
- Link the first-stage compressor to the second-stage compressor, and define the gear ratio of 2.486 as per the vendor curve.
- The temperature of the gas stream inlet to the second-stage export compressor should be below 55°C as per the recommendation of the compressor vendor.
- Validate the simulation streams’ data with actual plant data.
- Reduce the inlet pressure of the compressor, and optimize the compressor controlling parameters to meet the required gas export pressure and temperature limits for compressor suction and discharge.
Optimization
The requirement of reducing the inlet pressure of the export gas compressor is to operate the existing facility in LP mode. When the compressor operates at the same speed and flow, the inlet to the compressor decreases to 100 MMscfd from 150 MMscfd, the compressor operating point moves left and the compressor head increases, consequently raising the discharge temperature and pressure.
Reducing the compressor throughput gas flow causes an increase in the available discharge export pressure, which gives the option to reduce the inlet pressure of the gas. When the inlet pressure of the compressor drops, the operating point moves straight down at the same gas flowrate and causes a decrease in the compressor discharge pressure and temperature (i.e., available export pressure).
Once the compressor inlet pressure is reduced, the point is reached where the minimum required export pressure becomes available. Then, to check the minimum possible inlet pressure of the compressor, the compressor speed can be increased to the maximum operating speed. This causes a further increase in compressor discharge pressure and temperature, and allows for an additional decrease in the compressor inlet pressure.
In this way, the inlet pressure is reduced, step by step, while the discharge temperature of the compressor is checked (should be below 155°C) and the available export pressure is determined. When the inlet pressure is reduced at a constant compressor speed, there will be a point where the compressor becomes unstable as the operating point moves closer to the compressor surge line. This is the limit of the inlet pressure reduction at maximum speed. The reduction in inlet pressure should be stopped with at least a 0.5 bar–1 bar margin from the unstable limit.
The next step is to check whether the compressor discharge temperature is within the limit. If the discharge temperature is higher than the recommendation limit, then the optimum balance must be determined between the compressor speed reduction (resulting in reduced discharge temperature) and the compressor inlet pressure increment (resulting in increased compression ratio). From this balance, the best operating point can be determined. The compressor discharge temperature must be within the limit, and the compressor discharge pressure must also meet the minimum required available export pressure. In this way, the compressor operation can be achieved without recycle.2, 3
One vendor recommendation calls for a compressor design pressure of 350°F and a preferred discharge temperature limit of 330°F–340°F. (The compressor can be operated at a discharge temperature of 350°F for a short time.) The maximum compressor speed recommended is 9,100 rpm, which is the speed between the first-stage and second-stage critical speed limits for the compressor. Although the maximum possible speed is between the second and third critical speed limits of the compressor, it is not advisable to run the compressor at this speed because of the rotodynamic pumping of the machine.
The dry seal gas (fuel gas) temperature required at the inlet of the solar seal gas conditioning skid is 50°F above the fuel gas dewpoint, or 121°C–125°C, and a supply pressure of 100 psi above the compressor suction pressure. Seal gas supply is taken from the second-stage export gas compressor discharge before after-cooling; however, if the compressor discharge temperature is high, then the tie-in point for the fuel gas supply must be checked at another location.
Example for optimization. The optimization of a single compressor train, without recycle, for a gas flow of 50 MMscfd, is shown in Table 4. The steps to optimize the compressor controlling parameters, starting from the initial operating condition and using simulation results and graph, are also included. The initial operating conditions are:
- Compressor speed: 9,050 rpm (the speed should be kept on the higher side)
- Compressor inlet temperature: 40°C
- Compressor inlet pressure: 15 bar
- Export gas flow: 50 MMscfd
- Molecular weight of gas: 21.

First-stage compressor optimization. The curve in Fig. 3 is based on initial assumed operating conditions. The discharge temperature range for this curve is 171°C–183°C.
 |
|
Fig. 3. Head curve for first-stage compressor optimization, based on initial assumed |
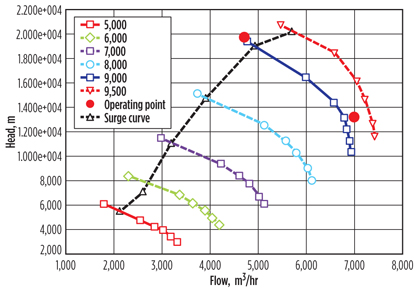
The curve in Fig. 4 shows that if the inlet pressure is reduced, then the actual volumetric flow will increase. This causes the operating point to shift right to the curve, and it also reduces the head and, consequently, the compression ratio. The discharge temperature range for this curve is 166°C–180°C.
 |
|
Fig. 4. Head curve showing that if the inlet pressure is reduced, then the actual |
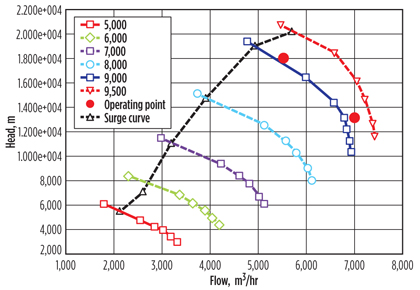
As shown in Fig. 5, the discharge temperature is very high, and the discharge pressure (export pressure) is also very high; therefore, the operating point must be moved lower. Also, the operating point must be kept close to the surge line, and the temperature must be reduced. This means that the inlet pressure can be further decreased, which reduces the discharge temperature and head (discharge pressure). Due to the increase in actual volumetric flow, the operating point remains at the surge line. The discharge temperature range for the curve in Fig. 5 is 153.4°C–167.9°C.
 |
|
Fig. 5. Head curve with lower operating point. |
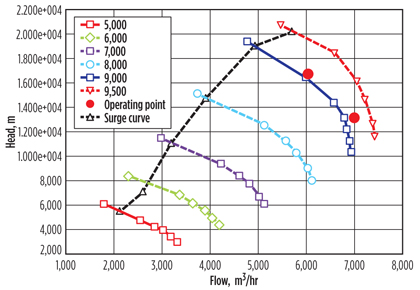
The inlet pressure can be further reduced to match the first-stage and second-stage operating points to the surge line, as shown in the curve in Fig. 6. The discharge temperature range for this curve is 148°C–157°C.
 |
|
Fig. 6. The inlet pressure can be further reduced to match the LP and HP operating |
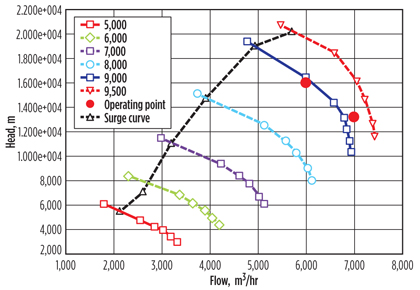
The inlet pressure reduction limit has already been reached, but the discharge pressure must still be reduced because the discharge pressure and temperature of the second stage is high, and the speed of the compressor must be reduced. The discharge temperature range for the curve in Fig. 7 is 142.4°C–154.7°C.
 |
|
Fig. 7. The inlet pressure reduction limit has already been reached, but the |
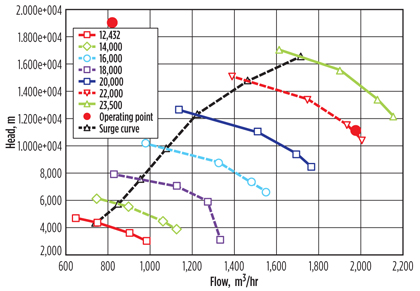
Second-stage compressor optimization. The curve in Fig. 8 is based on initial assumed operating conditions. The discharge temperature range for this curve is 171°C–183°C.
 |
|
Fig. 8. Head curve for LP compressor optimization, based on initial assumed |
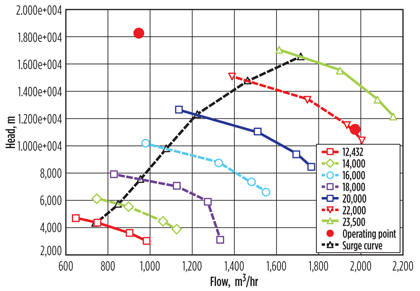
The operating point shows the surge condition for the curve in Fig. 9; therefore, the operating point must be brought down while simultaneously moving it to the surge line at right. The discharge temperature range for this curve is 166°C–180°C. There are two options for decreasing the inlet pressure and reducing the speed. If the speed is reduced, then the operating point will move downward because the volumetric flow is constant; however, if the inlet pressure is reduced, then the operating point will also move downward due to reductions in inlet pressure head and actual volumetric flow.
 |
|
Fig. 9. The operating point must be brought down while simultaneously moving |
For this reason, it is more beneficial to continue reducing the inlet pressure as a means of bringing the operating point to the surge line and achieving the minimum required export pressure. If the required export pressure (i.e., discharge pressure of the second-stage compressor) is not achieved, then the inlet pressure should be reduced slightly, moving the operating point further right to the surge line. In this way, the operating point does not move outside of the surge line (to the left side) when the discharge pressure increases as the speed of the compressor climbs.
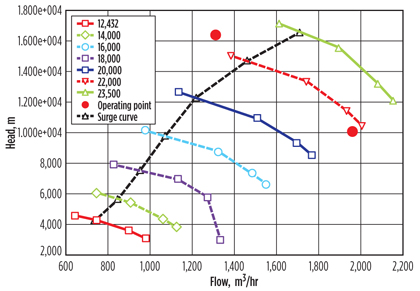
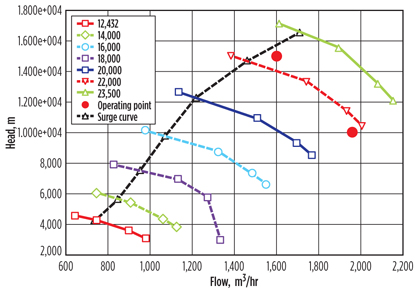
Figs. 10 and 11 show the head curve after further reductions in the inlet pressure. The discharge temperature range for the curve in Fig. 10 is 153.4°C–167.9°C, and for Fig. 11 it is 148°C–157°C.
 |
|
Fig. 10. Head curve after a further reduction in inlet pressure. |
 |
|
Fig. 11. Head curve after a second additional reduction in inlet pressure. |
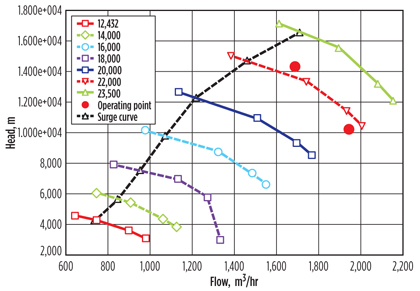
The curve in Fig. 12 shows that the discharge pressure is still greater than the required export pressure, so the inlet pressure can be further reduced. If the inlet pressure is decreased to 10 barg, then the operating point of the second-stage compressor runs far right to the curve, which is unacceptable. This means that 11 barg is the minimum suction pressure limit. If the discharge pressure is to be further reduced, then the speed of the compressor must be further reduced. The discharge temperature range for this curve is 142.4°C–154.7°C.
 |
|
Fig. 12. The discharge pressure is still greater than the required export pressure, |
Recommendations
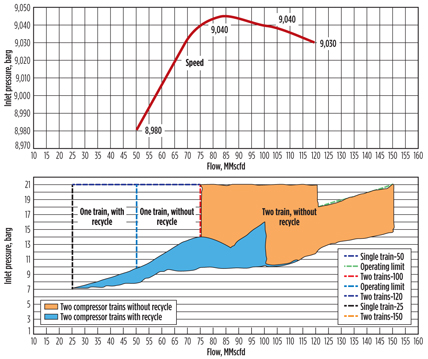
The compressor operating map shown in Fig. 13 was developed based on the results shown in Tables 5 and 6. Based on the results from the study, if a compressor is running at constant speed and the inlet pressure is reduced, then:
- The actual volumetric flow of gas increases
- The mass flow is constant
- The density decreases
- The head of the compressor or compressor discharge pressure decreases
- Less compression work is needed
- A lower compression ratio is needed
- A lower discharge temperature is needed
- Compressors operate at the same speed curve, but down the curve toward the stone wall
- Compressor efficiency may also be reduced down the curve
- The required export pressure is reduced.
 |
|
Fig. 13. Compressor operating map. |
The best way to check the lowest possible inlet pressure limit of a compressor is to first increase the speed of the compressor to the maximum level of 9,500 rpm. To stay on the safe side, a speed of 9,100 rpm can be used, as increased compressor speed can raise the discharge temperature and discharge pressure. The inlet pressure should be reduced until the required discharge pressure and discharge temperature (below 170°C) are achieved.
For safer operation, it is advised to take the maximum speed of the compressor to 90%–95% of its design speed when optimizing the compressor for reduced inlet pressure. When the compressor runs at maximum design speed for the design case flow, the compressor vibration may not be within the allowable region. As per standard operating practice, the compressor should not run beyond the first critical speed, which is based on the machine vibration level. GP
Notes
1The article is a product of the author’s own research and is not affiliated with any company or organization.
2The discharge temperature of the compressor could be reduced by recycling the flow, but the head of the compressor is also reduced. As the flow is recycled, the compressor throughput increases and causes the compressor operating point to shift right, to the same speed curve. Consequently, the head decreases, although the power consumption increases.
3Where multi-stage operation is involved, equal ratios of compression per stage are used (plus an allowance for piping and cooler losses, if necessary), unless otherwise required by the process design. For two-stage compression, the ratio per stage approximately equals the square root of the total compression ratio. For three stages, the ratio equals the cube root, and so on. In practice, especially in high-pressure work, decreasing the compression ratio in the higher stages to reduce excessive rod loading may prove to be advantageous.
 |
Lokesh Kumar Singh has been involved in developing process technologies and various stages of design—such as conceptual design, front-end engineering and design, detailed design, and independent design assessment—for greenfield and brownfield projects for more than 10 years. At present, he is working as a consultant in Kuala Lumpur, Malaysia. Mr. Singh received a BE degree in chemical engineering from the National Institute of Technology in Surat, India, in 2003. He is an active member of IChemE and the UK Engineering Council, and he has keen interests in technical report writing and process equipment design and optimization.


Comments