
Manage TEG liquid and corrosion in sales gas pipelines
H. KORDABADI and M. DINON, WorleyParsons, Brisbane, Australia
The gas industry has experienced encouraging worldwide growth in the last few decades and is poised to play an even more important role in the world’s energy future, in tandem with the growth of interest in renewable and alternative energy resources. Similarly, the coal seam gas (CSG) industry has grown rapidly over the past 15 years in Australia.
Since 2007, there has been a strong focus on using Queensland’s CSG resources to produce liquefied natural gas (LNG) for export; four major projects are in progress. Existing and planned infrastructure for these projects consist of thousands of kilometers (km) of transmission pipelines, with considerable cost. Reliability and robustness are required for sales gas pipelines to avoid interruption of gas supply to downstream facilities. These attributes must be considered in materials selection, design and operation.
The pipelines collect and transfer sales gas from upstream facilities to downstream customers (e.g., the LNG plants). Conventionally, pressurized gas is dehydrated with triethylene glycol (TEG) at upstream processing facilities. The sales gas pipelines are generally designed for dry gas operation. However, TEG losses in the form of vaporization and mechanical carryover lead to gradual liquid TEG accumulation within the pipeline. A small amount of water is also dropped out of the gas phase. For sales gas produced from natural gas, it is expected that some heavier hydrocarbon components will also condense; however, CSG is predominantly methane, so heavier hydrocarbons are not expected.
Generally, condensed liquid is not a serious problem for everyday operation of dry gas pipelines. It may be an operational concern for slug formation in transient conditions and pipeline inspection with intelligent pigging. Of greater concern, however, is that the condensed TEG and water may cause long-term corrosion on the internal wall of the pipeline if the water content is sufficiently high. In this study, the rate of liquid accumulation in a typical sales gas pipeline is reviewed, and the potential corrosion effect of the TEG/water presence on the pipeline is determined.
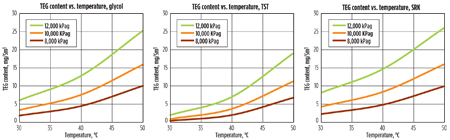
TEG content in gas phase.
The loss of TEG from the dehydration unit to the transmission pipeline occurs in two ways:
- Mechanical TEG carryover. The use of a filter coalescer at the discharge of the TEG dehydration units can mitigate overall liquid carryover and reduce it to 1 ppm; however, small droplets will be carried over into the pipeline.
- TEG vaporization. Vapor TEG loss accounts for considerably more of the TEG than mechanical TEG carryover, and is dependent on the operating conditions of the TEG contactor.
In low-pressure gas systems, TEG vaporization is low and inversely proportional to pressure, while, in high-pressure systems, the TEG vaporization rate is higher and directly proportional to the pressure, due to fugacity correction.1 The higher the temperature, the higher the TEG content is in the gas for a given pressure. TEG drops out of sales gas through the pipeline, because the gas temperature decreases as it approaches the soil temperature, and the pressure decreases because of frictional losses between the gas and the pipe wall.
The key to determining the amount of TEG vaporization is the modeling of the thermodynamics of the phase equilibria. Different thermodynamic packages predict different equilibrium conditions and, consequently, TEG content in the gas phase. A few thermodynamic packages have been recommended for TEG-water-methane phase equilibria. The Cubic-plus-association (CPA) equation of state (EOS) has been used to study TEG-water-gas phase equilibrium, with a focus on hydrate formation.2 The Twu-Sim-Tassone (TST) EOS has been recommended for TEG-methane gas phase equilibrium.1 Since vapor pressure models are not recommended for the high-pressure gas systems, they are not recommended for the TEG dehydration and pipeline simulation.3
 |
|
Fig. 1. TEG content in gas. |
In this simulation study, a proprietary process modeling program, complete with thermodynamic packages, was used for the simulation of the TEG/gas phase equilibrium. The TEG content envelope is shown in Fig. 1. These thermodynamic packages have been selected with regard to operational experience, software recommendations and/or published literature.1, 3
The TEG content of the gas phase increases non-linearly with temperature and pressure; however, the different thermodynamic packages predict different TEG content at any given temperature and pressure conditions. The TEG content curves in Fig. 1 have been determined with an assumed water content of 35 milligrams per standard meters cubed (mg/Sm3). Simulation analysis showed that the water content in the gas competed with the TEG content of the gas phase. In the following sections, the TEG condensation rate is determined using all three thermodynamic packages.
Process overview.
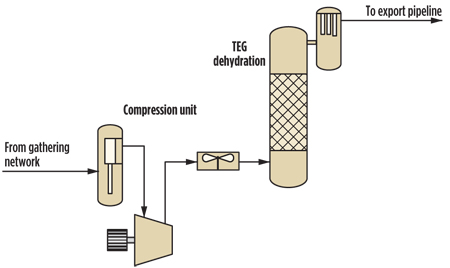
A typical CSG processing scheme is shown in Fig. 2. In the processing facility, gas is first compressed and then dehydrated in a TEG contactor. The TEG contactor vapor outlet is equipped with a filter coalescer to minimize TEG carryover. The processing facility may contain more than one processing scheme in parallel.
 |
|
Fig. 2. Gas processing facility scheme. |
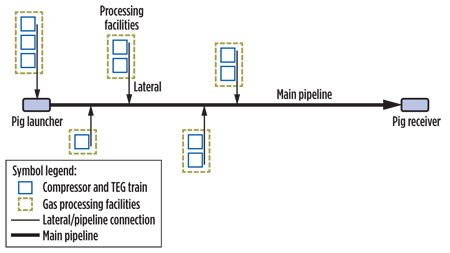
The processing facility supplies gas to the export pipeline via a lateral (short pipeline). The export pipeline is typically buried, and transfers gas from the processing facilities to the customer, generally over large distances (several hundred km). Usually, an export pipeline collects gas from several processing facilities. A typical arrangement of processing facilities and the export pipeline is shown in Fig. 3.
 |
|
Fig. 3. Typical arrangement of processing facilities and an export pipeline. |
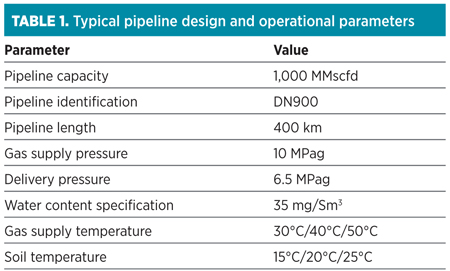
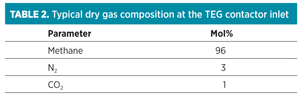
Typical pipeline operating and design parameters have been summarized in Table 1. Maximum allowable operating pressure (MAOP) is presumed to be the same as the maximum supply pressure. Minimum, normal and maximum gas supply temperature corresponds with minimum, normal and maximum temperature of soil. This is obviously at some distance along the pipeline, as gas exiting the facilities may be warmer. The typical composition for the dry CSG is summarized in Table 2.
|
|
For the purposes of the study, a list of assumptions has been made:
- The study is performed using a steady-state simulation with the parameters listed in Tables 1 and 2
- The proprietary process modeling program and its thermodynamic packages are suitable for simulating TEG-water-methane phase equilibrium
- TEG dehydration is the final process in the gas processing facility train
- A filter coalescer at the TEG contactor outlet removes particles over 0.3 microns in size, which can be equated with 1 ppm of TEG in the gas at the pipeline intake
- Intelligent pigging is typically conducted every 5–7 years, at which time liquid must be removed from the pipeline system
- The detailed effect of gas hydraulics is not considered in this study; however, a simple hydraulic simulation is performed here to provide pressure and temperature inputs to the study
- Transient hydraulic (e.g., ramp-down) has not been considered in this study.
Liquid accumulation in gas pipelines.
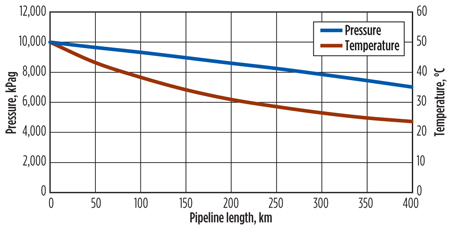
For the purposes of this study, it can be assumed that the main pipeline has a single gas feed at the inlet. Based on provided design parameters for the pipeline in Tables 1 and 2, a hydraulic simulation is performed. The typical gas pressure and temperature profiles, as a function of distance traveled along the pipeline, for an inlet condition of 10,000 gauge pressure (kPag) and 50°C, are shown in Fig. 4.
 |
|
Fig. 4. Sales gas pressure and temperature as functions of distance along the pipeline, using the Glycol model. |
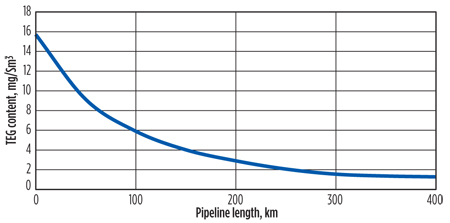
The TEG content in the sales gas flow can be determined according to the pressure and temperature profiles along the pipeline. TEG content through the pipeline is shown in Fig. 5.
It corresponds with the pressure and temperature trends in Fig. 4. Also, it shows that the TEG condensation rate decreases through the pipeline, with most of the condensation occurring in the first 100 km.
The TEG content profile along the pipeline, for a set inlet pressure and temperature, is presented in Fig. 5. In actual operation, inlet pressure and/or temperature may change because of planned changes in setpoints, or ambient temperature changes during the time of day and time of year. It is necessary to consider all operating condition changes to determine TEG vaporization and condensation over a set period of time.
In this study, it is assumed that the inlet pressure is constant. However, the ambient temperature influences the gas temperature at the cooler outlet in the processing facilities and at the soil temperature. Temperature has considerable influence on the TEG/gas phase equilibrium. Using maximum ambient temperature for TEG dropout calculation leads to an impractically high level of TEG loss and, consequently, an unrealistic volume of liquid accumulation in the pipeline. Therefore, it is better to use the real annual temperature trend for TEG vaporization and condensation determination for a period of time.
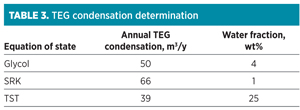 |
The annual TEG condensation rate estimated by using steady-state simulation with set conditions is given in Table 3. Average water fraction in the liquid has also been provided from simulation outputs. Operational experience for similar cases shows that the liquid TEG in the pipeline for similar operating conditions may contain less than 5% water.
The calculated condensation rate cannot be completely validated because of the high level of uncertainty in the operational data. A thorough examination and assessment of the three thermodynamic options cannot be completed without experimental data. From the above analysis, however, TST can be eliminated due to the fact that its prediction for water fraction is considerably different from any industrial experience.
When traces of TEG condense through the pipeline, a two-phase mixture is formed. Condensed TEG establishes a mist-flow regime and moves through the pipeline. A part of this liquid TEG will settle down on the internal wall and establish a liquid TEG film. Determination of the accumulation rate vs. condensation rate is complex, and reliable operational data to validate theoretical models are not available. However, it is presumed that the established TEG mist will attach to the wall shortly after condensation. As long as the established TEG film is thin and moves very slowly, liquid re-entrainment in the gas flow is unlikely. It is presumed that all condensed TEG will be accumulated in the pipeline.
The rate of liquid accumulation is very low, and pigging usually occurs for sales gas pipelines in a certain period of time (e.g., every year). Therefore, the liquid accumulates in the form of a thin film (e.g., 100 microns) on the pipeline wall in normal hydraulic conditions. Moreover, this study assumes that the film thickness is uniform across the inner pipeline circumference and that there is only a remote chance of pool formation in low points during normal operation.
 |
|
Fig. 5. Typical TEG content in sales gas (gas phase) as a function of distance along the pipeline, using the Glycol model. |
 |
|
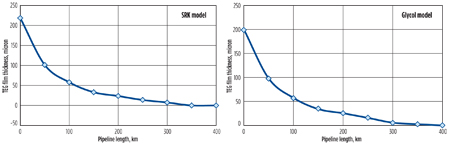
Fig. 6. Typical TEG film on the internal wall of the pipeline using the Glycol and SRK models. |
It can be seen in Figs. 5 and 6 that, as the TEG content falls in the gas phase through the pipeline, the TEG dropout rate—and, consequently, the film thickness—decrease as well. The average thickness for the condensed TEG can be determined according to TEG dropout within the pipeline for one year of operation. The calculated TEG film thickness, using the Soave-Redlich-Kwong (SRK) and Glycol thermodynamic packages, is shown in Fig. 6.
The simulation investigation shows that liquid film formation for sales gas obtained from natural gas follows a similar pattern. Although the overall composition of the liquid film in the natural gas pipelines is slightly different due to the impact of the heavy hydrocarbon components, the condensation rate and the film thickness through the pipeline are similar. Also, the chance of sludge formation in natural gas pipelines is higher.
The results of this study are useful in the development of pigging philosophies—e.g., requirements for liquid handling facilities. Moreover, the simulation results provide a basis to evaluate how condensed TEG affects pipeline corrosion management, which is discussed in the following sections.
Effect of glycol on corrosion rate.
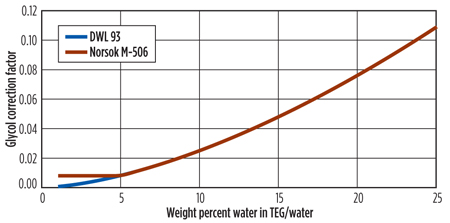
It is well known that glycol reduces the corrosion rate of steel in wet CO2 environments. A number of models are available that help predict the magnitude of glycol’s mitigating effect on corrosion. The two models considered here are the de Waard and Lotz 935 approach, and the Norsok M-506.6 These models determine a glycol correction factor that is applied to the base corrosion rate in the absence of glycol to determine the corrosion rate in the presence of glycol.
 |
|
Fig. 7. Glycol correction factors on corrosion rate. |
The glycol correction factor will, by definition, be 1 at 0% glycol. The two models are identical, except that de Waard and Lotz reduces the glycol correction factor to 0 at 100% glycol, and Norsok M-506 maintains the glycol correction factor at 0.008 above 95% glycol. The effect of absorbed water content in the glycol phase on the glycol correction factor is shown for both models in Fig. 7.
TEG effect on corrosion.
As discussed previously, TEG present in the gas phase leads to the establishment of a thin TEG film on the pipe wall, or it may pool locally in low points. In this study, TEG pooling will not be considered, and it is assumed that TEG accumulates in a thin film on the wall. Liquid TEG contains a low percentage of water. As explained in the previous section, this may cause corrosion in the presence of CO2, if the water content increases for any reason. Generally, the TEG unit outlet is monitored to determine dehydration upset and allow manual intervention by an operator to shut in production to mitigate corrosion issues.
As expected from the total condensation rate, Fig. 6 shows that the film thickness is similar in both the glycol and SRK results. However, the glycol thermodynamic package leads to a higher water percentage in the condensed liquid, so it will be used for the following analysis since it is more conservative.
A corrosion allowance is not normally required for sales gas pipelines due to the normally dry nature of the gas. In the event of an upset condition at the TEG units, hydrated gas may enter the pipeline and cause corrosion. The effect of off-spec gas entering the pipeline must be evaluated with respect to corrosion to ensure that the risk of pipeline corrosion is understood.
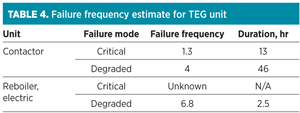
The estimated failure frequency of TEG process units is available from reliability, availability and maintainability (RAM) literature.4 A summary of availability data for a TEG contactor and electrical regenerator for a single-train dehydration unit is shown in Table 4. Critical failures will cause a TEG unit trip, and the result is interruption to dehydration. Estimated durations to fix the problem and bring the TEG unit back to the normal condition are also provided in Table 4.
 |
In general, gas quality can be divided into three categories:
1. On-spec gas. Water content meets the sales gas specification. The TEG unit supplies on-spec gas to the pipeline in normal conditions.
2. Wet gas. Sales gas is saturated by water. In the case of a tripped TEG unit, wet gas may be injected into the pipeline. The effect of wet gas supply on corrosion issues is investigated here.
3. Off-spec gas. Water content in the gas is between wet gas and on-spec gas levels. Upset operation and imperfect dehydration result in off-spec gas supply. Hypothetically, the water content of the off-spec gas is equivalent to dehydrated gas with 10% tray efficiency in the TEG contactor vs. 50% tray efficiency in normal conditions. Although the effect of off-spec gas supply on corrosion issues can be investigated similarly to the wet gas supply, it is not the focus of this simulation study due to the unclear definition of “off-spec.”
The simultaneous failure of multiple TEG units is assumed to not occur. This study assumes multiple gas suppliers for the gas transmission pipeline, as shown in Fig. 2, instead of a main pipeline with a single intake.
The simulation study has been performed to assess the impact of dehydration upsets and wet gas entering the pipeline system. Two cases from the arrangement in Fig. 2 are developed to investigate the effect of TEG unit failure on gas quality and corrosion issues in the pipeline system:
- Case 1: The lateral transfers gas from a one-train gas processing facility
- Case 2: The lateral transfers gas from a two-train gas processing facility.
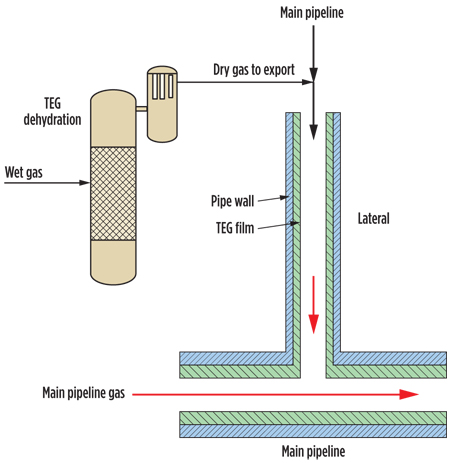
For both cases, lateral size and length are assumed to be 20 in. and 20 km, respectively. The capacity of each TEG dehydration train is assumed to be 100 million standard cubic feet per day (MMscfd). The other parameters are the same as before. A more detailed model for the above cases is shown in Fig. 8. In the model, the TEG unit(s) dehydrates gas, and sales gas is injected into the main pipeline through the lateral. A TEG film forms on the pipe wall during gas transmission.
 |
|
Fig. 8. System arrangement for TEG dehydration injecting gas |
The presence of a TEG film on the pipe wall is expected to play a key role in pipeline corrosion. In the case of wet or off-spec gas supply to the lateral, the TEG film, which is in equilibrium with on-spec gas in normal conditions, will absorb water vapor, which leads to TEG film dilution. When the TEG unit is brought back online, on-spec gas flows within the pipeline system, stripping the diluted TEG film of water. As a result, water fraction in the TEG film will return to the normal condition. Therefore, TEG failure and wet gas injection into the pipeline system are a part of a reversible cycle.
It is difficult to model water absorption and stripping phenomena through the pipeline system accurately because of the unknown mass-transfer model in the system. However, absorption/desorption rates and water fraction in the TEG film can be estimated on average to assess the effect of TEG unit upsets on lifetime corrosion. The results of the simulation are illustrated according to the natural sequential cycle of normal and upset conditions in Table 5.
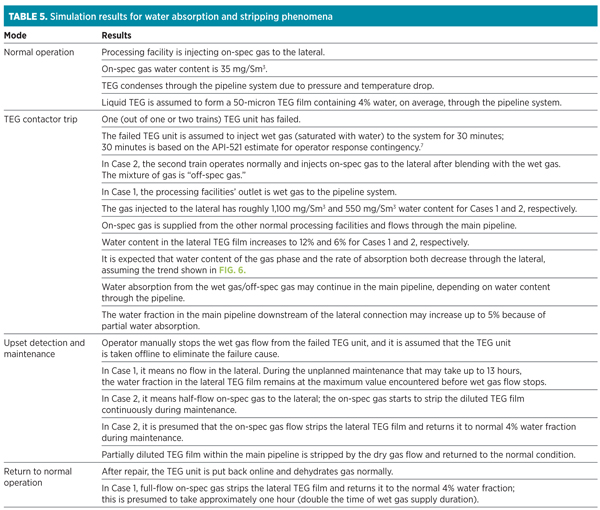 |
The corrosion rate can be determined according to the impact of the water fraction in the TEG film. Calculations show that corrosion rate and wet gas supply to the pipeline is high during upset condition. However, the overall corrosion rate for lifetime service is negligible because TEG process availability is high.
Process simulation shows that, in the absence of TEG film, the water vapor in the wet gas condenses through the pipeline system due to a temperature drop on the dry pipeline wall. During upset condition, a thin film of water forms on the pipe wall and causes corrosion. It may exceed 2 millimeters for lifetime service. Therefore, the TEG film on the pipeline wall acts as a buffer to protect the pipeline material from short-term corrosion effects during upstream dehydration upsets.
Takeaway.
TEG accumulation in the pipeline system has been demonstrated, and the quantities determined, to provide inputs for a pigging philosophy, liquid management and corrosion assessment. The key issues in the developed model and simulation are the overall operating condition and the thermodynamic package. Both the SRK and Glycol thermodynamic packages are validated equations of state for TEG-water-methane phase equilibrium. The liquid TEG profile within the pipeline system has been determined, and it shows that TEG accumulation rate and film thickness both decrease through the pipeline system, so that the majority of condensation occurs in the first quarter of the pipeline length.
The simulation study shows that upsets in the TEG process lead to TEG film dilution due to water absorption from wet gas and off-spec gas. An excessive water fraction in the TEG film may cause a high rate of corrosion. However, on-spec gas strips the TEG film and removes water from the liquid phase as the TEG process is brought back to normal gas supply. A simulation was performed to examine the reversible cycle of upset and normal operation. It estimated the maximum encountered water fraction in the TEG film as well as the duration of TEG film dilution and stripping.
The process simulation provided inputs for a corrosion management study. Corrosion rate calculations show that the upset in a TEG unit potentially brings about a considerable corrosion rate during the upset, but a negligible corrosion rate for lifetime service in the sales gas pipeline. However, adequate corrosion monitoring is recommended for any unknown corrosion issues. The study confirmed that the TEG film on the pipeline wall mitigates the impact of the short-time wet gas injection to the pipeline and its prominent role in corrosion rate determination. GP
ACKNOWLEDGMENT
The authors wish to thank Kevin Olson and Stuart Smyth for their technical support and help in completing the study and preparing this article.
LITERATURE CITED
1Wassenhove, W. V., “Using a more thermodynamically adapted model improves modeling of TEG dehydration units, allows better operation and efficiency,” Gas Processors Association Europe Annual Conference, Antwerp, Belgium, May 2006.
2Kontogeorgis, G. M., G. K. Folas and N. Muro, “Modeling of associating mixtures for applications in the oil and gas and chemical industries,” Fluid Phase Equilibria 261, 2007, pp. 205–211.
3ASPEN HYSYS V7.3 and APEN HYSYS Simulation Basis.
4Offshore Reliability Data Handbook, 5th ed., SINTEF Technology and Society.
5De Waard, C. and U. Lotz, “Prediction of CO2 corrosion of carbon steel,” Corrosion 93, NACE, Houston, Texas, 1993.
6Norsok Standard M-506, “CO2 corrosion rate calculation model,” Rev. 2, June 2005.
7API-521, Pressure-relieving and depressuring systems, 5th ed., 2007.
HOJAT KORDABADI is a senior process engineer with demonstrated experience in the oil and gas industry. Since 2001, he has been involved in several large-scale projects and performed several engineering studies. Mr. Kordabadi joined WorleyParsons in 2011 and presently works in gas processing projects executed through concept selection and FEED. He has published several articles in the oil, gas and petrochemical industries. Mr. Kordabadi holds a BSc degree in chemical engineering from Amir Kabir University and an MSc degree in chemical engineering from Shiraz University. He is a registered professional engineer (PE) in Queensland, Australia.
MIKE DINON is the principal materials engineer at WorleyParsons’ Brisbane office. He has over 40 years of materials engineering experience, primarily with operating companies, prior to joining WorleyParsons. Mr. Dinon has special interests in corrosion and materials selection. He holds a BAppSc degree in secondary metallurgy and an MSc degree in corrosion. He is a registered PE nationally in Australia and a registered PE in Queensland, Australia.


Comments