
Shale hydrocarbons ushering an industrial renaissance in North America
P. GUNASEELAN, Vantage Point Advisors, Houston, Texas; and
M. THUNDYIL, Transcend Solutions, Houston, Texas
A remarkable surge in shale oil and gas production in North America is radically reshaping the global energy landscape. The primary beneficiary of this shale revolution is the US, where a resurgence in domestic manufacturing and a transformation to an export center of hydrocarbons are underway, reversing historical trends. Shale natural gas (NG) and natural gas liquids (NGL) are playing a pivotal role in this new dynamic, driving interest both in their domestic use and exports, and creating numerous opportunities for gas processing and NGLs recovery. In particular, the abundance of low-cost shale hydrocarbons has repositioned North America as a leading competitive supplier of chemicals and petrochemicals derived from gas and NGLs, driving a slew of announcements of newbuild production capacity.
As the shale gas sector has rapidly evolved, it has been accompanied by a shortage of credible information regarding the extent of its impacts on the hydrocarbon processing industry (HPI). To address this gap, future trends and markets for NG and NGL within the HPI, especially in the US, will be discussed. The focus includes the use of liquefied natural gas (LNG) and compressed natural gas (CNG) as engine fuels, gas-to-liquids (GTL) and NGL-based petrochemicals.
NG AS AN ENGINE FUEL
The underlying driver for switching to NG as an engine fuel is its favorable price differential in the US compared to refined fuels such as diesel, gasoline and fuel oil (FO). At present, NG fuel is approximately $1 to $2 cheaper per equivalent gallon than diesel and gasoline.1–3 NG can provide an economic incentive for switching to LNG in diesel-intensive applications such as high-mileage commercial trucking and offroad industrial applications. Low NG prices are also driving the penetration of CNG vehicles in low-mileage, medium- and light-duty fleets with centralized refueling stations.
The cost savings in switching to NG helps recoup the premium for the NG-capable engine and fuel systems. For example, the estimated payback period for heavy-duty LNG trucks is 2–3 years.4 Advances in NG engine and fuel-system technologies continue to serve as technical and economic drivers. There is also an environmental driver for NG as an engine fuel; it is cleaner burning and inherently lower in sulfur and other contaminants. NG has a smaller carbon footprint as compared to diesel and FO. Finally, the US government is showing support for NG as a transportation fuel.5 These early indications are shaping meaningful federal and state-level incentives and could serve as regulatory drivers for future growth. Aside from the price premium for NG engines over conventional gasoline and diesel engines, a more limiting barrier is the unavailability of NG distribution and refueling infrastructure. Stakeholders in the NG and transportation sectors are taking steps to address this gap.
NG trends and developments
The economic driver for NG as a transportation fuel has spurred considerable activity across the value chain, including NG fuel producers, refueling infrastructure developers, engine manufacturers and fleet operators. Some activities, such as the development of refueling infrastructure, are being spearheaded by the private sector without government incentives. This discussion will focus on developments on an important market niche: LNG for heavy-duty trucking.
The US long-haul trucking market is the largest diesel consumer, accounting for nearly 65% of 2010 consumption.6 As this market is fuel-intensive, switching to cheaper LNG fuel is attractive to fleet operators. In recent years, Westport and its affiliate CumminsWestport have led the charge in commercializing 8.9-liter (l) and 15-l NG engines with LNG fuel systems; these engines have been adopted by major truck manufacturers. CumminsWestport will commercialize a spark-ignited 11.9-l NG engine, which is expected to increase LNG penetration in trucks.7 Emission Solutions Inc. is another original equipment manufacturer (OEM) of NG engines with products in the 7.3 l–7.6 l range, and it is aligned with truck manufacturer Navistar.8 Clean Air Power is working with OEMs and truck manufacturers to champion dual-fuel technology to enable diesel engines—both new and existing—to operate on NG.9 A number of fleet operators such as UPS, Ryder and Waste Management have placed orders for LNG trucks.10–12 There are some viable commercial options for LNG trucks in the long-haul market, and additional compelling offerings can be expected in the immediate future as the market continues to develop.
With regard to LNG-refueling infrastructure, Clean Energy has pioneered this critical market segment, having completed construction of 70 stations in the first phase of a network called America’s Natural Gas Highway. An additional 70–80 stations are slated for construction during 2013.13 Shale gas producer Chesapeake is among Clean Energy’s major investors, having committed $150 million (MM) in 2011.14 In 2012, Shell announced plans to develop LNG fueling infrastructure in the US.15 Linde successfully demonstrated a mobile LNG-fueling unit as part of a trial for fleet-operated LNG trucks.16 It is also developing technology for stationary fueling stations.
Potential LNG demand in the US transport sector is also driving market activity in the supply portion of the value chain. Pivotal LNG, a subsidiary of AGL Resources, owns and operates five liquefaction facilities with a total capacity of 540,000 gpd (540 Mgpd) of LNG targeting the transport and high-horsepower (hp) markets.17 Shell announced building a small-scale liquefaction facility near its Jumping Pound gas plant in Alberta to supply its planned network of LNG fueling stations.18 GE entered into an agreement with Clean Energy to supply and finance two modular micro-LNG units capable of producing 250 Mgpd of LNG, with the flexibility to scale up to 1 MMgpd as the market develops.19 ConocoPhillips is exploring the construction of a 100-Mgpd liquefaction plant in Midlothian, Texas.20
In addition to the heavy-duty trucking market, providing LNG to high-hp applications such as rail and marine transportation, and offroad transport and off-grid power-generation applications, is also possible. For lower-mileage fleets, a similar trend is underway in which CNG vehicles are gradually replacing diesel and gasoline equivalents. As with LNG, this trend is also driven by the favorable price discount for NG. However, because of the lower energy density of CNG and resulting shorter range on a full tank, CNG vehicles are better suited to urban markets with return-to-base fleets and centralized fueling, such as metropolitan fleets of buses, refuse trucks, utility vans and trucks. More details on the US CNG market are available in the literature.21
Impact on transportation markets
The market penetration of NG vehicles is supported by favorable pricing. Incidentally, this trend is displacing domestic consumption of diesel and gasoline. NG is expected to primarily displace diesel over time with LNG in fuel-intensive applications such as long-haul trucking and high-hp applications.
To a smaller extent, NG is expected to displace diesel and gasoline with CNG in urban return-to-base fleets. A study by the Canadian Energy Research Institute found that the US heavy-truck market is approximately 8 MM vehicles and consumes 2 MMbpd–2.5 MMbpd of crude oil-based fuels.22 According to the US Energy Information Administration’s (EIA’s) 2013 Annual Energy Outlook reference case,26 US total liquid fuel consumption is estimated to be flat over the long term. By 2040, the EIA forecasts that about 1.7 tcf of natural gas (including GTL fuels) will be converted to fuel heavy-duty transport.
Other independent estimates of NG penetration into the transport fuel markets are more aggressive. In PIRA Energy Group’s high-case scenario, NG could displace nearly 2.4 MMbpd of diesel by 2030, of which 1.7 MMbpd would be attributable to LNG usage in Class 8 trucking.23 A 2010 study by the Argonne National Laboratory21 estimated, in an aggressive scenario for NG vehicle market penetration (36% by 2030), that NG adoption could reduce US oil consumption by 1.6 MMbpd.
GTL
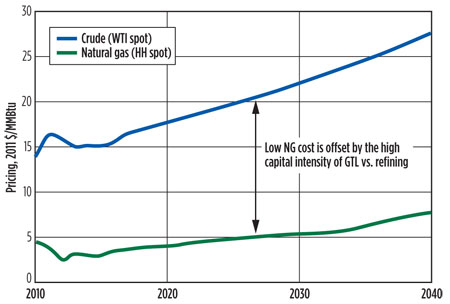
As shown in Fig. 1, the decoupling of NG and crude prices has created a new paradigm that is reviving interest in GTL projects. The price of crude is driven primarily by transportation fuels, a market that cannot effectively leverage the US abundance of NG. GTL is a compelling alternative to the direct use of NG as a transport fuel via LNG or CNG. In the classic GTL process, NG is converted to diesel or mixed alcohols that can be blended with conventional transport fuels and would require no changes to infrastructure or engines.
 |
|
Fig. 1. The decoupling of US oil and NG prices is driving opportunities for GTL. |
GTL products are premium products; they are essentially sulfur free.24 Fischer-Tropsch (FT) diesel is a premium diesel blendstock, while FT naphtha, with its low-octane and paraffinic nature, is better suited as ethylene feedstock or as diluent for bitumen.24
Market developments
Several US-based GTL projects have been announced. The largest GTL project is Sasol’s 96-Mbpd project in Louisiana requiring 1 billion scfd (Bscfd) of gas, and a capital investment of $11 B–$14 B.25 This translates into a capital cost of $110,000/bpd to $140,000/bpd of liquid production. Shell is also reported to be considering a 100-Mbpd GTL facility in Louisiana at a cost of $10 B.27 Even at a capital cost of $200,000/bpd, GTL can have a reasonable internal rate of return.24 On a smaller scale, Calumet is planning a 1-Mbpd GTL plant.28
Impact on refined products
If all of the announced US GTL projects are completed and reach full capacity by 2020, GTL could contribute nearly 200 Mbpd of liquid products to the domestic refined products pool. Based on typical yields, this could translate to a combined 160 Mbpd of distillate fuel (120 Mbpd of diesel and 40 Mbpd of jet fuel), 34 Mbpd of paraffinic naphtha and 6 Mbpd of LPG. If the availability of cheap NG is sustained over the long term, then the success of these announced projects will serve as a stimulus for further growth in GTL capacity.
SHALE-BASED NGL—ETHANE
The shale hydrocarbon boom has played a pivotal role in the revival of the US and global petrochemical sectors. The driver is cheap ethane recovered from shale gas plays. Ethane has grown rapidly as the preferred feedstock for ethylene, displacing traditional feedstocks such as refinery naphtha, gasoil and propane. Between 2005 and 2012, US ethane production grew at 6% CAGR from 670 Mbpd to 990 Mbpd, and it is forecast to double by 2020.29, 30
The prospect of long-term, cheap ethane supplies has initiated a slew of ethylene cracker expansions and newbuild projects. The combined output of the announced projects is nearly 11 MMtpy. Industry forecasts project that around 15 MMtpy of ethylene capacity could be added from 2010–2020.31 Ethane cracking capacity could nearly double to about 2 MMbpd in this time frame.30 To put the capacity increase in perspective, consider that present North American ethylene capacity is around 30 MMtpy, and global capacity is approximately 140 MMtpy.32, 33
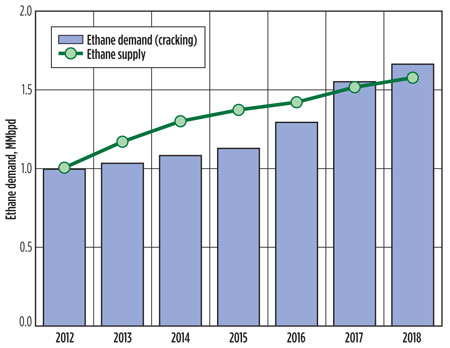
US ethane supply is outpacing installed ethylene cracking capacity, creating an oversupplied market. Consequently, ethane pricing reached a 20-year low.34 Some analysts predict that the US ethane surplus will peak at around 5.5 MMtpy in 2015 until the new crackers come online in 2016–2017.35 If all the expansions and newbuilds are completed, then there could be a potential shortfall of 3.5 MMtpy of ethane. Fig. 2 illustrates the potential supply-demand imbalances.
 |
|
Fig. 2. US ethane supply-demand forecast showing the present supply surplus and future shortfalls. |
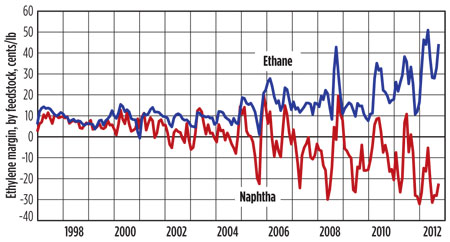
Olefin crackers typically use feedstocks such as naphtha, LPG or ethane. The feedstock ethane-to-naphtha margin spread for ethylene has widened to $0.40/lb, as shown in Fig. 3.36, 37 This margin spread has driven the conversion of US crackers to ethane over naphtha. Ethane crackers produce 78% ethylene and 3% propylene relative to propane crackers, which produce 42% ethylene and 17% propylene. Naphtha crackers, meanwhile, produce 31% ethylene, 16% propylene, 8% crude C4s and 28% pyrolysis gasoline and gasoil.35, 38 Therefore, switching to ethane cracking results in the loss of naphtha cracker byproducts—i.e., propylene, butadiene and heavy aromatics—which are trading at historical highs.35 Analysts note that, despite the growth in ethylene from cheap US ethane, naphtha crackers will continue to be built in China.39
 |
|
Fig. 3. The switch from naphtha to ethane as feedstock for ethylene crackers is driven by superior margins.37 |
The US Internal Revenue Service ruled in October 2012 that companies converting ethane and other NGLs to olefins can be classified as master limited partnerships (MLPs). This tax designation provides an incentive for midstream players to enter the cracking market.40 The implication is that ethylene producers can derive tax benefits from the marketing, transportation and storage of olefins. Estimates of tax benefits to ethylene producers range in the hundreds of millions of dollars.41
Ethane NGL trends and developments
As in the case for NG, the present ethane oversupply has reduced prices, thus weakening the incentive to recover ethane. On a Btu basis, ethane pricing was nearly at parity with NG.42 However, if the price of fractionation and transportation (approximately $0.10/gal) is backed out, the ratio of ethane price to NG drops to around 0.6, which creates an incentive for gas processors to reject ethane into NG.43 However, since the market is mainly large players, market rebalancing could be expected quickly once major players decide to switch to ethane-rejection mode. This also indicates that the price of NG is the floor price for ethane.
The low price of US ethane has sparked interest in transporting it as feed to European crackers. Ineos announced a 15-year deal to purchase ethane from Marcus Hook for transport to Rafnes, Norway, in LNG tankers sourced from Evergas.43, 44
Propylene. As crackers switch from naphtha to ethane, propylene production is adversely impacted. Ethane cracking yields about 3% propylene, whereas naphtha cracking yields around 17%. Other propylene sources are refinery fluid catalytic cracking (FCC) units, which primarily produce gasoline. As gasoline demand declines, refinery-based propylene production will decline (with the exception of refineries that have made modifications to boost propylene yield). These changes have taken about 1.5 MMtpy of propylene capacity out of the market, with another 2 MMtpy of capacity required to meet growing demand.36 Since 2006, there has been a decline of nearly 40% in propylene capacity.46
The need for propylene capacity has led to announcements of five on-purpose propylene units, four of which are propane dehydrogenation (PDH) units and one a metathesis unit, with a combined capacity of 2.8 MMtpy. Enterprise, which is building a 750-Mtpy PDH unit for 2014, already has offtake commitments for the plant’s entire capacity and is considering a second PDH unit.46 Other players planning new capacity include Dow Chemical Co. (750 Mtpy), Formosa Plastics (600 Mtpy) and LyondellBassell (227-Mtpy metathesis unit). Alternative routes to propylene include methanol-to-propylene, with at least one US producer reportedly considering this route.47
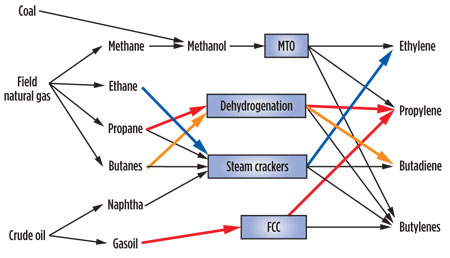
Similarly, global butadiene production has been hampered by the switch to ethane in the olefin crackers and coal-to-methanol-to-olefins plants in China; both processes produce very little butadiene. TPC Group has announced plans to restart its 270-Mtpy butadiene unit.48 Fig. 4 summarizes how the switch to ethane is driving changes within the supply routes for propylene and butadiene.
 |
|
Fig. 4. The switch to ethane cracking is driving on-purpose propylene and butadiene and FCC propylene. |
Ethane impact on HPI
New reports indicate that US naphtha consumption by olefin crackers has dropped from 10.4 MMtpy in 2009 to 8.2 MMtpy in 2011, with the bulk of the naphtha being exported either for use as diluent for Canadian bitumen or to Asia as ethylene feedstock.49 The ratio of NGLs to refined products feeding US ethylene crackers, historically at 70:30, is now at 88:12, and it is expected to increase to 95:5.47 Result: US refiners may need to seek alternate outlets for refined products being displaced by NGLs.
By 2020, US ethylene capacity is projected to increase to 15 MMtpy, all of which will be ethane based. Following the historical market share, about 30%, or 4.5 MMtpy, of this capacity can be attributable to the displacement of refined products that would have been used as ethylene feedstock. Assuming a 31% yield of ethylene, which is typical for naphtha cracking, this translates to 15 MMtpy (300 Mbpd) of displaced refinery naphtha.
The loss of propylene production capacity due to ethane switching by steam crackers is a near-term opportunity for US refiners with FCC capacity. As gasoline demand declines, US refiners can repurpose their FCC units to boost propylene production until adequate on-purpose capacity comes onstream.
Propane and butane from shale gas
LPG consists mainly of propane and butane, and the increased production of NGLs has significantly increased US LPG production. Global LPG production is around 7.7 MMbpd and comprises 65% of global NGLs production.50 North American LPG production is around 1.5 MMbpd. US propane production from shale gas has risen to 750 Mbpd from 630 Mbpd in 2011.51 Due to the oversupply, US propane prices hit a three-year low.47 Refineries have historically produced about half the propane in the US, but growth is flat.52 Propane is an alternative to ethane and naphtha as a feed for steam crackers. The LPG glut in the US caused by constrained export infrastructure has led some ethylene producers to run their crackers on propane feed. But with the planned expansions in LPG export infrastructure, this trend is expected to be short-lived.
Normal butane (n-butane—hereafter, butane) is the predominant C4 NGL recovered from shale gas. Between 2005 and 2012, US butane production grew at 4% compound annual growth rate, from 177 Mbpd to 234 Mbpd, representing less than a third of US propane volumes.29 The largest domestic market for butane is gasoline blending. Due to a declining gasoline market and to tightening Reid vapor pressure specifications for gasoline limiting butane use, this market is not expected to grow over the long term. While butane has been used in the past as an ethylene feedstock, the prospect of cheap ethane and propane reduces its viability in that market.
Consequently, owing to flat or declining domestic LPG demand, the surge in shale-derived LPG production has prompted an increase in US exports, which rose 27% in 2012.52 LPG exports have more than doubled from the historical trend of 50 Mbpd53 and are constrained by the existing infrastructure. This has resulted in plans to expand export capacity. Enterprise intends to increase capacity by 88% at its Houston terminal, and Targa has purchased land, dock and rail assets to expand its capacity.52 The Enterprise terminal is expected to increase export capacity to 10 very large gas carriers (VLGCs), with Targa adding 4 VLGCs of capacity.52 US LPG is being exported to South America, displacing product from Europe.
LPG impact on HPI
The LPG surge from shale gas production has created a glut in the US, competing with refinery LPG volumes in the export and ethylene feedstock markets and exerting price pressure. US refiners can expect such competitive pressure until new LPG export infrastructures are expanded and, subsequently, when on-purpose C3 and C4 olefin plants using propane or butane as feedstock come onstream.
Pentanes-plus from shale gas. The pentanes-plus portion of the NGLs pool is what remains after the recovery of lighter NGLs from NG, and it is similar in composition to light naphtha. This stream is alternatively referred to as C5+, plant condensate or natural gasoline. With growth in US shale gas and a shift to wet plays, C5+ grew at 1.6% between 2005 and 2012, from 266 Mbpd to 298 Mbpd.29 Accordingly, it is a modest contributor to the shale NGLs pool and it is not growing as rapidly as lighter NGLs.
Historically, C5+ was used as a gasoline blendstock or as a feedstock for ethylene. However, as the domestic gasoline market declines and the switch to ethane continues for ethylene production, an oversupply of C5+ is looming. Unlike lease condensate, plant condensate is not subject to export restrictions. It can find ready export markets such as Canada for diluting bitumen, in Asia as an ethylene feedstock, or elsewhere as a gasoline blendstock. C5+ will compete for these markets with refinery naphtha that is also displaced by ethane as a petrochemicals feedstock. Further, C5+ used as diluent in Canada will indirectly impact the US refined products pool as more refineries process C5+-containing bitumen.
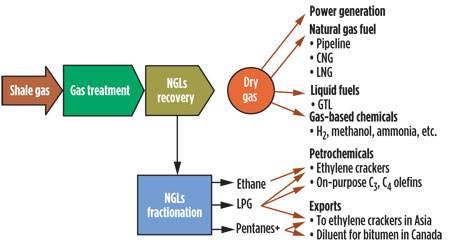
Takeaways
The impacts of key shale gas-derived hydrocarbons on the HPI are summarized in Fig. 5. NG will be used as a transportation fuel, particularly as LNG for heavy-duty trucking. The EIA forecasts that, by 2040, NG and its derivative fuels (LNG, CNG and GTL) will replace diesel in the US market. Shale-derived ethane is rapidly growing as the feedstock of choice for US ethylene crackers, displacing refinery naphtha, GO and LPG. Possible alternate outlets for paraffinic naphtha include exports for bitumen dilution or Asian ethylene production.
 |
|
Fig. 5. Summary of potential impacts of shale hydrocarbons on the HPI. |
The loss of propylene production capacity with the switch to ethane feedstock in steam crackers is driving plans to build on-purpose capacity for propylene and C4 olefins. As gasoline demand declines, US refiners may repurpose FCC units to boost propylene production over the short term. Due to softening domestic demand, the surge of LPG from shale gas production is competing with refinery LPG volumes for export markets and driving investments on the Gulf Coast to expand marine export infrastructure. GP
ACKNOWLEDGMENT
The article is a revised and updated version from a presentation at American Fuels and Petrochemical Manufacturers (AFPM) Annual Meeting, March 17–19, 2013, in San Antonio, Texas.
LITERATURE CITED
1http://www.westport-hd.com, US average LNG fuel price: $2.92 per diesel gallon equivalent; diesel fuel: $3.93 per gallon. data for the week of Jan. 28, 2013.
2http://www.cngprices.com, US average CNG fuel price: $2.10 per gasoline gallon equivalent, Feb. 12, 2013.
3http://fuelgaugereport.opisnet.com/index.asp, US average regular gasoline fuel price: $3.604 per gallon, Feb. 12, 2013.
4http://www.westport-hd.com/advantages/savings-estimator; Estimated using calculator on Westport website, Single LNG tank, 5 mpg, 125,000 annual miles, and average LNG and diesel prices for the week of Jan. 28, 2013.
5Rascoe, A. and C. Bohan, “Obama to propose tax credit for natural gas trucks,” Reuters, Jan. 26, 2012.
6National Petroleum Council, Heavy Duty Vehicles, Chapter 3: Study on Future Transportation Fuels, Feb. 5, 2013.
7Ahlers, M. and T. Dunnan, “At nation's truck stops, talk of diesel, gas, chicken and eggs,” http://www.cnn.com/2012/12/07/us/trucking-gas-future, Dec. 7, 2012.
8Emissions Solutions Inc., http://www.emissionsolutionsinc.com, January 2012.
9Clean Air Power, http://www.cleanairpower.com, January 2012.
10UPS press release, http://pressroom.ups.com/Fact+Sheets/ci.LNG+Fact+Sheet.print, 2011.
11“Ryder Orders 202 Heavy-Duty Natural Gas Trucks,” http://newsroom.ryder.com/press-release/fleet-management-solutions/ryder-orders-202-heavy-duty-natural-gas-trucks, March 31, 2011.
12“Waste Management Adds 1000th Truck to Natural Gas Fleet,” http://www.wm.com/about/press-room/pr2011/20110712_Waste_Management_Reaches_1000th_Natural_Gas_Truck.pdf, July 12, 2011.
13“Clean Energy Announces Completion of First Stage of Its Nationwide Network of Natural Gas LNG Fueling Stations for Long-Haul, Heavy-Duty Freight Trucking,. http://www.cleanenergyfuels.com/news/2012/12-5-12.html, Dec. 5, 2012.
14“Chesapeake Energy to Invest $150 Million in Clean Energy,” http://www.cleanenergyfuels.com/news/2011/7-11-11.html, July 11, 2011.
15“Natural Gas Fuel Option,”http://www.shell.us/aboutshell/us-media-center/news-and-press-releases/2012/06072012-natural-gas.html, June 7, 2012.
16“Linde teams with customer to successfully demonstrate its LNG mobile fueling unit,” http://www.lindeus.com/en/news_and_media/press_releases/rnanews2012-11-15a.html, Nov. 15, 2012.
17http://pivotallng.com, January 2012.
18Shell’s 2011 Sustainability Report, http://reports.shell.com/sustainability-report/2011/ouractivities/deliveringenergyresponsibly/naturalgas/liquefiednaturalgas.html.
19“GE and Clean Energy Fuels Partner to Expand
America’s Natural Gas Highway,” http://www.cleanenergyfuels.com/news/2012/11-13-12.html, Nov. 13, 2012.
20“ConocoPhillips Eyes Midlothian for Liquefaction Plant,” http://www.downstreamtoday.com/News/ArticlePrint.aspx?aid=37886, Dec. 3, 2012.
21Werpy, R., et al., “Natural Gas Vehicles: Status, Barriers, and Opportunities,” Argonne National Laboratory Report, August 2010.
22Rozhon, J., “Natural Gas Vehicles—A Review,” Canadian Energy Research Institute study, March 2011.
23Natural Gas Vehicles Gaining Traction, http://www.pira.com/docs/marketingpdf/
piranewsletter.pdf?sfvrsn=2
24Salehi, E., et al., “Viability of GTL for the North American gas market,” Hydrocarbon Processing, January 2013, pp.41–48.
25Sasol Press Release, http://www.sasollouisianaprojects.com/news.php?action=submit&story_id=47&type=P, Dec. 3, 2012.
26US EIA, Annual Energy Outlook 2013, early release, Dec. 5, 2012.
27Gold, R., “Shell weighs natural gas to diesel processing facility in Louisiana,” http://online.wsj.com/article/SB10001424052702304072004577323770856080102.html, April 4, 2012.
28Calumet Press Release, http://www.prnewswire.com/news-releases/calumet-specialty-products-partners-lp-announces-plan-to-expand-its-karns-city-pa-specialty-products-facility-168801896.html, Sept. 6, 2012.
29EIA, Annual Energy Outlook 2013, Fig. 39 data, April 15–May 2, 2013.
30Fasullo, P., “Outlook for US Ethane: Always Climbing a Wall of Worry,” 2nd Platts NGL Conference, Sept. 24, 2012.
31Horncastle, A., et al., “Future of Chemicals Part IV: Global Feedstock Developments and Implications for GCC Players,” Booz & Co., 2011.
32“Petrochemicals – Preparing for a Supercycle,” http://www.morganstanley.com/views/perspectives/preparingfor_supercycle.pdf, Oct. 18, 2010.
33True, W., “Global ethylene capacity continues to advance in 2011,” http://www.ogj.com/articles/print/vol-110/issue-07/special-report-ethylene-report/global-ethylene-capacity.html, July 2, 2012.
34“Eagle Ford behind expected Texas petchems, plastics exports growth,”
www.platts.com, Dec. 31, 2012.
35DiLallo, M., “What attractive ethylene margins mean for investors,” www.dailyfinance.com, Jan. 21, 2013.
36Thompson, J., “Booming Shale Gas Production Drives Texas Surge,” Southwest Economy, 4th Quarter 2012.
37“Upgrading of fractions by cracking and reforming,” Agfa DIDAC-2 Teaching Module, http://old.iupac.org/didac/Didac%20Eng/Didac02/Content/P02.htm.
38McKinsey & Co., “McKinsey on Chemicals,” No. 4, Spring 2012.
39DiLallo, M., “The new trend to watch in petrochemicals,” www.dailyfinance.com, Jan. 25, 2013.
40Chang, J., “US olefins may see tax breaks in Master Limited Partnerships,” http://www.icis.com/Articles/2012/10/17/9604914/us-olefins-may-see-tax-breaks-in-master-limited-partnerships.html, Oct. 17, 2012.
41Staas, P., “Rejected!,”https://www.energyandincomeadvisor.com/rejected/. Dec. 23, 2012.
42Braziel, R., “The ethane asylum: Big time ethane rejection in the shale gas world,” www.ogfj.com, Jan. 7, 2013.
43Fuquay, J., “Swiss firm moves to ship Marcellus ethane overseas,” http://blogs.star-telegram.com, Jan. 24, 2013.
44Maykuth, A., “Fifteen year deal to ship ethane via Marcus Hook,” http://articles.philly.com, Jan. 25, 2013.
45“EPP propane dehydrogenation unit full,” http://www.ogj.com/articles/2013/01/epp-propane-dehydrogenation-unit-full-second-unit-being-considered.html, Jan. 8, 2013.
46Greenwood, A., “Tight US propylene may lead to 2 more PDH plants,” http://www.icis.com/Articles/2012/06/25/9572490/tight-us-propylene-may-lead-to-two-more-pdh-plants.html, June 25, 2012.
47Baumgarten, S., “US TPC group approves funding for on-purpose butadiene project,” http://www.icis.com/Articles/2011/08/09/9483770/us-tpc-group-approves-funding-for-on-purpose-butadiene-project.html, Aug. 9, 2011.
48Gale, G., “USA’s future as a naphtha exporter,” www.pfaa-online.com/docs/2011/PFAA-K-11.ppt, November 2011.
49Gist, R., “Recent developments in the international supply and demand of propane,” NPGA 2012 Winter Board of Directors Meeting, www.npga.org, Jan. 30, 2012.
50Payne, J. and M. Robinson, “US Shale boom redraws LPG market map,” http://articles.chicagotribune.com/2013-01-17/news/sns-rt-usa-shalelpgl6n0ak8va-20130117_1_largest-lpg-exporter-export-infrastructure-naphtha, Jan. 17, 2013.
51Murillo, C., “Natural Gas Liquids in North America: Overview and Outlook to 2035,” Canadian Energy Research Institute study, July 2012.
52Arnsdorf, I., “Gas Exports from U.S. Surge as Sanctions Undermine Iran,” http://www.bloomberg.com/news/2013-01-15/gas-exports-from-u-s-surge-as-sanctions-undermine-iran-freight.html, Jan. 14, 2013.
53Insley, M., “Iran’s loss is our gain,” http://dailyreckoning.com/irans-loss-is-our-gain/, Jan. 16, 2013.
PRAVEEN GUNASEELAN is the founder and president of Vantage Point Advisors, a consultancy focused on addressing critical business and technical challenges for clients in the oil and gas value chains. Dr. Gunaseelan has specialized expertise in gas processing, petroleum refining, chemicals, and shale hydrocarbons. He has published articles in leading trade journals and industry conferences. Prior to Vantage Point, he worked as an engineering consultant at Exponent and as a market analyst and process engineer at Air Products & Chemicals. Dr. Gunaseelan holds a PhD in chemical engineering from Purdue University and a BS degree in chemical engineering from the University of Bombay. He is a Professional Engineer in the State of Texas.
MATT THUNDYIL of Transcend Solutions has been involved in the global energy industry since the early 1990s. Dr. Thundyil was involved in licensing, designing and manufacturing of advanced technologies. These technologies were used to improve performance and throughput of process plants in the gas processing, refining, chemical and petrochemical industries. He has extensive experience with gas processing, refining and petrochemicals. Dr. Thundyil has co-authored a number of peer-reviewed publications and numerous presentations. He holds several US patents.


Comments