
Commercializing flared gas for the Nigerian market through small-scale liquefaction
T. Kuru and E. Iyagba, University of Port Harcourt, Port Harcourt, Nigeria
Natural gas is an underutilized energy and chemical resource in Nigeria, despite the country having 187 Tcf of proven reserves. While Nigeria produces 3.5 Bcfy of associated gas, approximately 2.5 Bcfy is flared. Nigeria may be losing over $2 B/yr from flaring associated gas.1 Data from the US National Oceanic and Atmospheric Administration show that Nigeria is the world’s second-largest gas flaring nation, after Russia.2 However, per liter of oil produced, Nigeria exceeds Russia in gas flaring.3
In Nigeria, companies exploring for crude oil have failed to develop adequate infrastructure to process and market associated gas, and so they continue to flare it. Prohibitive factors to the establishment of a gas processing infrastructure are high costs for reinjection/storage, inadequate enforcement of the gas flare penalty and the zero-flare policy, poor gas pricing policies, and the substantial cost of developing gas gathering and pipeline systems. Security issues and risk of contracts being breached are also complicating factors. As a result, a large potential revenue stream to the energy sector is being blocked.
Nigeria, a country with over 150 million people, is approaching an era of economic development. Independent power plants (IPPs) are starting up around the country. Utilizing the country’s gas resource to meet its energy needs, especially electricity, will curb gas waste, and it holds great potential for growth and revenue generation.
Liquefaction technology makes gas more compact and easy to transport. With the development of LNG technology and markets, it is expected that local industries will convert from the use of diesel to gas. However, the increasing problem of pipeline sabotage by vandals—especially in the Niger Delta area, where most of the country’s oil is found—makes locating LNG plants near hydrocarbon sources a preferred option. With small-scale LNG plants, continuous LNG production and subsequent transportation to customers are achievable via truck, train or small LNG carrier on Nigeria’s inland waterways.
For a small-scale LNG plant with a nominal design capacity of 36 MMscfd of gas, the single mixed-refrigerant (SMR) technology is a desirable liquefaction model,4 especially since specific power per kg of LNG produced remains the main criteria for selecting a liquefaction plant. The SMR also occupies a smaller footprint and is a relatively simple process.
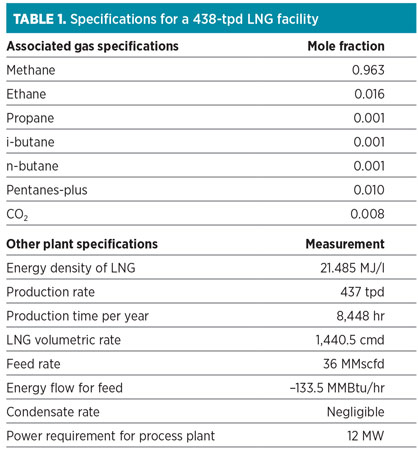
Computer simulation of the LNG plant was carried out for a production rate of 438 tpd, and the results were used to perform the cost estimates and financial analyses detailed here.
Gas-related laws and incentives. As detailed in Nigeria’s constitution and the Petroleum Act, the entire ownership and control of all petroleum resources and reserves in the country is vested in the federal government.5
Due to the impact that the LNG market is expected to have on the petroleum industry, Nigeria’s federal government came up with incentives to attract investors. The Associated Gas Framework Agreement (AGFA) of 1991 and 1992, and the Company Income Tax Act of 2007, provide incentives for gas companies, and they are incorporated into the provisions of the Petroleum Industry Bill of 2012. Such incentives include:
- A tax rate of 40%, which is the same as the Company Income Tax Act
- A tax holiday under a pioneer status of seven years, which may be granted to new companies engaged in gas transmission and distribution
- A capital allowance of 20%/yr in the first four years, 19%/yr in the fifth year and 1%/yr in the books
- An initial tax-free period of 10 years for LNG projects
- Exemption from paying withholding tax on interests and dividends paid to non-residents for LNG projects
- An accelerated capital allowance after a tax-free period, which includes exemption from value-added tax and import duties for plant equipment and machinery; an annual allowance of 90%, with a 10% retention in the books for investment in machinery; and an additional investment allowance of 15%, which cannot reduce the value of assets.
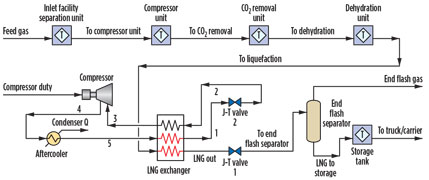
LNG facility. Small-scale liquefaction processes for onshore applications typically include a feed gas pretreatment section, a liquefaction section, and the storage and transfer of LNG to trucks/carriers (Fig. 1). Feed gas, supplied to the facility via pipeline, flows into an inlet system, where hydrocarbon separation from the feed is carried out. If present, NGL may be recovered and stored.
 |
|
Fig. 1. Process flow diagram of a small-scale gas liquefaction facility. |
Impurities like mercury, carbon dioxide (CO2), debris and water, if present, are eliminated before liquefying the gas under cryogenic conditions. Nigeria’s gas, like its oil, is low in sulfur.1 Mercury, which causes corrosion in process equipment, is removed using molecular sieves, or by adsorption on sulfur-impregnated carbon or alumina carriers.6
The gas is compressed and sent to a scrubbing system, where hydrogen sulfide (H2S) and CO2 are removed in a recirculated amine system using a proprietary solvent. Dehydration of the gas is accomplished by contacting it with a hygroscopic liquid, such as triethylene glycol (TEG), to ensure high purity. The treated gas, which is mostly methane, is then liquefied at ambient conditions using suitable mixed refrigerants. The resulting LNG is stored in tanks at cryogenic conditions for transfer to markets.
The LNG plant is self-sufficient in terms of power demand, as gas turbines supply the plant and vessel electricity requirements (Table 1). Gas turbine fuel requirements can reach 12% of the total gas feed rate for offshore plants.7 The gas turbine fuel demand is 7% for onshore plants.4
 |
Safety considerations. Potential hazards associated with natural gas liquefaction include vapor clouds, rapid phase transition, freezing liquid, rollover and explosion. These factors create a necessity for strict adherence to safety requirements in the handling and storage of LNG.
General safety requirements include government, legal and regulatory frameworks for safety that are applicable to the Nigerian oil and gas industry, safety assessments of LNG process facilities and processes, safety instructions and regulations on gas processing, emergency responses to accidents, and safety and leadership management.
Specific safety requirements include facility layout, design and construction, safety of process units, safe disposal of waste and safe transport of materials. A written work permit should be in place, along with instructions for tools handling, hazards and safety. Setting up an adequate incident-handling system to properly respond to accidents like gas leaks, explosions and fire should also be implemented.
Four requirements for safety provide multiple layers of protection against accidents and incidents in the LNG processing business. The primary containment of LNG ensures that the materials used to store LNG are of the appropriate design, type and strength. Secondary containment ensures the isolation and prevention of leaks and spills.
The use of safeguard systems ensures the protection of lives and property. Such safeguards include emergency shutdown; alarm systems in case of equipment failure, accidents and LNG releases; proper fire detection and firefighting systems; and proper procedures and training with respect to incident handling.
Lastly, maintaining an adequate separation distance between LNG facilities and the neighbouring communities minimizes population exposure to emissions and operations. It also improves security. The safety zone should be based on the assessment of risks from potential hazards.
Preliminary process economy. For all pressure vessels in the plant, the wall thickness is used to calculate shell mass. The shell mass is then used to estimate the cost of pressure vessels in accordance with the American Society of Mechanical Engineers’ Boiler and Pressure Vessel code.8
Most equipment is built from type 304 stainless steel. The cost of procuring and installing process equipment is also calculated from cost data listed by Sinnott and Towler,8 and is used to make preliminary estimates. The correlation used is shown in Eq. 1:
Ce = a + bSn(1)
where:
Ce=Purchased equipment cost, in dollars, on a
US Gulf Coast (USGC) basis
a, b=Cost constants
S=Size parameter
n=Exponent for particular equipment.
The chemical engineering plant cost index (CEPCI) for 2014 on a USGC basis is 630.925. The cost index ratio (CIR) is 1.201 (using 2007 as a reference year). The location factor (LF) for Nigeria is calculated from the method described by Sinnott and Towler8 and approximated as 1.0.
The estimated equipment cost for 2014 is calculated as shown in Eqs. 2 and 3:
Ce(2014) = Ce(2007) × CIR × LF(2014)(2)
Ce(2014) = Ce(2007) × 1.201 × 1.00(3)
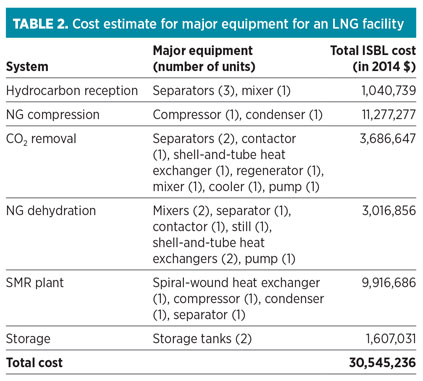
The factorial method8 of cost estimation is used to make a relatively accurate estimate of inside battery limit (ISBL) costs. The estimate captures other direct cost items incurred during construction, such as equipment erection, piping, electrical, instruments, building, storage and utilities (Table 2).
 |
Estimating expenditures and profits. The total fixed capital investment (FCI) comprises ISBL, offsites (OS), design and engineering (D&E) and contingency (X). The factors for OS, D&E and X are obtained using Eq. 4:8
Total FCI = Total ISBL (1 + OS)(1 + D&E + X)(4)
where:
OS=0.3
D&E=0.3
X=0.1.
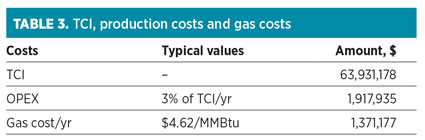
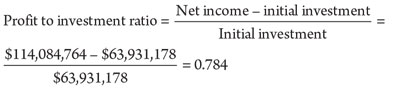
For the LNG plant, total FCI = $30,545,236 (1 + 0.3) (1 + 0.3 + 0.1) = $55,592,329. The total capital investment (TCI) will depend on the FCI and the working capital (WC); i.e., TCI = FCI + WC. The WC is 15% of the FCI. The WC for the LNG plant equals $8,338,849. The TCI is calculated as TCI = FCI + WC. The TCI = $55,592,329 + $8,338,849 = $63,931,178.
The annual production cost is estimated as the sum of the variable costs (raw materials, miscellaneous materials, utilities); fixed production costs (maintenance, operating labor, supervision, plant overhead, capital charges, insurance, local taxes); and sales expenses.9 The operating expenditure (OPEX) is typically 3%/yr of TCI (Table 3).4
 |
Using the data given in Table 1, the total energy per year for LNG can be calculated as 1.032576395 × 10⁷ MMBtu/yr. The production cost can be calculated using Eq. 5:
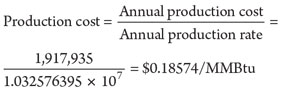 (5)
(5)
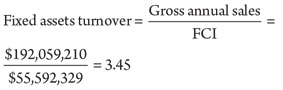
With the price of LNG hovering at approximately $18.6/MMBtu, gross annual sales can be calculated from Eq. 6:
Gross annual sales = unit selling price × annual production rate(6)
$18.6 × 1.032576395 × 107 = $192,059,210/yr
LNG projects enjoy incentives from the Nigerian government, and the financial benefit of a small-scale liquefaction venture is greatly favored, as shown in Eq. 7:
 (7)
(7)
The gross margin of the LNG plant can be calculated from Eq. 8:
Product margin (gross margin) = Revenue – raw material cost
= $192,059,210 – $1,371,177(8)
= $190,688,032/yr.
With an OPEX (or cash cost of production) of $1,917,935, the gross profit can be calculated as shown in Eq. 9:
Gross profit = Revenue – OPEX(9)
= $192,059,210 – $1,917,935
= $190,141,274/yr.
The income tax rate at 40% is $76,056,510. Net profit is calculated from Eq. 10:
Net profit = gross profit – taxes
= $190,141,274 – $76,056,510(10)
= $114,084,764/yr.
The profit to investment ratio is shown in Eq. 11:
 (11)
(11)
The profit margin on sales is calculated as shown in Eq. 12:
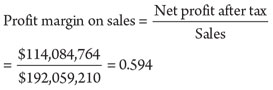 (12)
(12)
Without any reinvestment, return for the first year is calculated from Eq. 13:
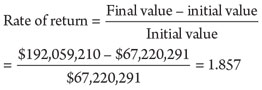 (13)
(13)
Payout period. The payout period is expressed in months and is calculated using the net cashflow for each month. On average, the cash inflow per month is $15,004,934. The monthly tax is $6,338,042, and the monthly OPEX is $159,828. The monthly cost of gas feedstock is $114,265. The new cash flow for the first month can be calculated from Eq. 14:
Net cash flow for first month = cash inflow in first month – cash outflow = $16,004,934 – $6,338,042 – $159,828 – $114,265 = $9,392,799(14)
In the sixth month, the cumulative cash flow is $56,356,794. In 24 days, the cash flow is $7,574,385. Therefore, the payout period is equal to six months and 24 days.
Takeaway. The Nigerian government is willing to curb gas flaring and encourage investors to monetize its associated gas. The Nigerian business environment also harbors prospective customers with a dire need for energy.
The LNG market in Nigeria has not realized its potential because the use of pipelines for gas transportation is not favorable. Small-scale liquefaction and sale of natural gas are profitable means of venturing into Nigeria’s energy sector. GP
ACKNOWLEDGMENT
The authors thank the Department of Chemical Engineering at the University of Port Harcourt for its support in this research work, particularly the chair in Gas Engineering. Financial assistance was provided by the Petroleum Technology Development Fund (PTDF).
LITERATURE CITED
1Ribadu, N. and S. Olasupo, Review of the Nigerian petroleum industry, Petroleum Revenue Special Task Force, p. 35, 2012.
2Ahmed, M. M., A. A. Bello and M. N. Idris, “Natural gas utilization and the Nigerian gas-to-liquid project: An opportunity to end gas flaring,” International Journal of Emerging Trends in Engineering and Development, Iss. 2, Vol. 2, p. 244, 2012.
3Samuel, P., “GTL technology—challenges and opportunities in catalysis,” Bulletin of the Catalysis Society of India, p. 82, 2003.
4Morgan, J., “Rules of thumb for screening LNG developments,” Presentation to IE Aust (Engineering Australia), Perth, Australia, p. 11, 2012.
5Onyekonwu, M., “Nigeria gas issues,” PTDF Gas Research Group, University of Port Harcourt, Port Harcourt, Nigeria, presentation, 2007.
6Madhavan, S., “LNG technology,” KBR Inc., Houston, Texas, presentation, p. 17, 2010.
7Finn, A. J., “Effective LNG production offshore,” Costain Oil, Gas & Process, Manchester, UK, pp. 3–10, 2003.
8Sinnott, R. and G. Towler, Chemical Engineering Design, 5th Ed., Butterworth-Heinemann, New Delhi, India, pp. 293–314, 2009.
9Sinnott, R., Chemical Engineering Design, 4th Ed., Butterworth-Heinemann, New Delhi, India, p. 267, 2005.
 |
Tuka Kuru holds a BTech degree in chemical and petrochemical engineering from the Rivers State University of Science and Technology in Port Harcourt, Nigeria. Mr. Tuka also completed a master’s degree program in chemical engineering from the University of Port Harcourt. He has worked as a process design engineer with Integral Computing and Research Centre Ltd. He is also a member of the Nigerian Society of Chemical Engineers and the Nigerian Institute of Management.
 |
Elijah Iyagba is a professor of chemical engineering at the University of Port Harcourt. He holds a BEng degree in chemical engineering from Obafemi Awolowo University in Ile-Ife, Nigeria, as well as an MEng degree in chemical engineering and an MEng degree in petroleum engineering. Dr. Iyagba also holds a PhD in chemical engineering from the University of Pittsburgh in Pennsylvania. He is a member of the Nigerian Society of Chemical Engineers and the Nigerian Institute of Management, and he is a registered member of the Council for the Regulation of Engineering in Nigeria.


Comments